R.1717
Friction between wheel and rail
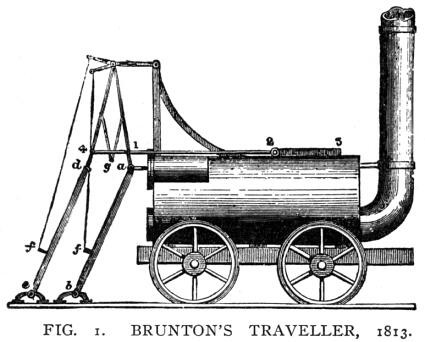
Two hundred years ago, the mines of northern Europe were producing large amounts of coal. It was taken away in horse-drawn trucks typically weighing about two tonnes, and the horses would often struggle to get a foothold. So when it was proposed to replace the horses with steam engines running on metal rails, engineers weren’t sure whether the wheels would grip the rails with sufficient friction to overcome sloping terrain [7] [8]. One of the more remarkable solutions was proposed in 1813 by William Brunton (figure 1). His Mechanical Traveller was pushed from behind by a pair of steam-powered legs, one of several walking engines produced during this extraordinary period. But experiments soon showed that walking engines weren’t needed: provided it was heavy enough, a locomotive with smooth steel wheels could pull a considerable load. Since that time, the level of friction between wheel and rail has been a central preoccupation among railway engineers. It determines how fast a train can accelerate, the distance it needs to stop, and ultimately the volume of passengers and goods that a rail network can carry.
Figure 1
The friction mechanism
When designing a transport system, the engineer must use the laws of friction to predict how vehicles will grip the running surface. But as explained in Section G2016, they are not fundamental laws in the same sense, for example, as Newton’s Laws of Motion. In the case of a railway system, the friction process that takes place within the contact patch where the wheel presses against the rail is physically complex and varies widely from one section of railway track to another depending on the weather and the condition of the rail surface.
What happens in the contact area
There are several distinct processes that contribute to friction. If you look at them closely enough under a microscope, you’ll see that all surfaces are slightly rough, so that when two of them are forced into contact, there will be some mechanical interlocking between peaks and troughs, rather like two pieces of sandpaper rubbing over one another with the teeth of one surface getting trapped in the hollows of the other, and vice versa. In the case of a railway vehicle, however, this interlocking process doesn’t figure greatly because the surfaces are relatively smooth. A second possible mechanism involves loose material between the wheel and rail. As shown in figure 2, particles of grit or flakes of metal, torn away during previous impacts, can plough through the contact surfaces and increase their resistance to sliding [5]. But the dominant mechanism is adhesion. Adhesion is a force that arises on the atomic scale, between the electron shells of neighbouring molecules. As described in Section G2016, adhesion is concentrated at the high spots that are in close contact with the neighbouring surface. These high spots undergo a ‘slip – stick’ process; they are continually pressure-welded together then torn apart (figure 3). The effect is particularly powerful for metals. If you make two specimen blocks in the laboratory each having a surface that is optically flat and chemically pure, when the surfaces are brought together the blocks will fuse in such a way that they are almost impossible to pull apart.
Figure 2
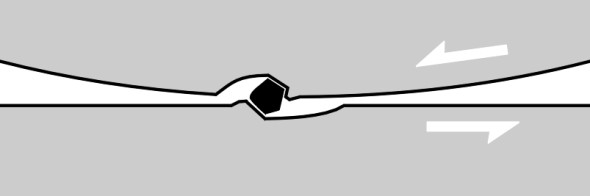
Figure 3
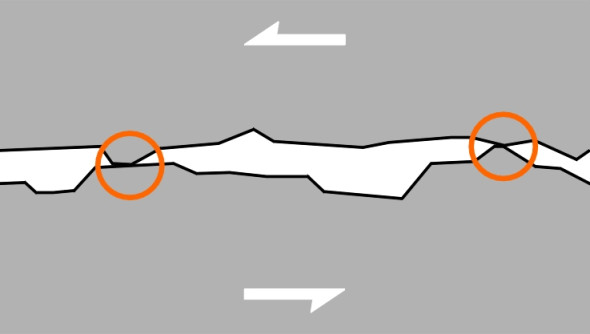
Fortunately perhaps, the surfaces of everyday objects are almost never chemically ‘pure’, because when exposed to the atmosphere most metals will become oxidised within a matter of minutes [2]. More important from the point of view of the railway engineer is the effect of contaminant films such as water, organic detritus, or grease from vehicular traffic, all of which form barriers to contact and thereby reduce the coefficient of friction. Surface contaminants combined with the smooth rail surface mean that, compared with cars and lorries, railway vehicles must operate with quite low levels of grip. The coefficient of friction between the wheels and rail is at most 0.5 on a dry rail [11] and 0.3 on a wet one, and less in frost. To be on the safe side, it is usual to assume a value of 0.2 in daily operation. These figures apply when the wheel is rolling normally and each part of the tread is ‘locked’ momentarily to the rail surface as it passes through the contact patch. The value falls appreciably when the wheel starts to slide [9]. Other factors that influence the traction have to do with the vehicle itself: as is the case with pneumatic tyres, the coefficient of friction decreases with increasing wheel load and also with vehicle speed over 100 km/h [6].
Creep and friction
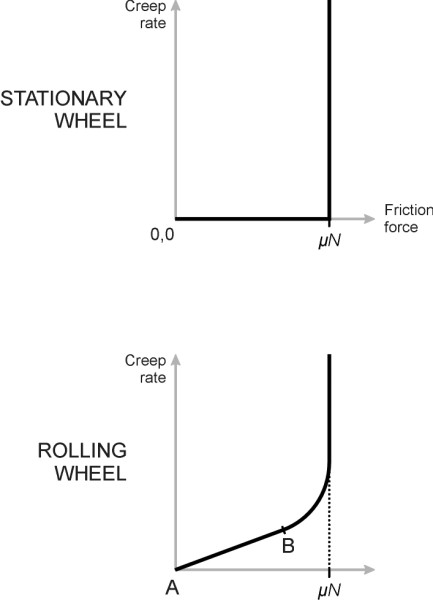
If you put a book flat on the table and try to push it sideways, you are applying a shear force or traction across the interface. If you don’t push hard enough the two surfaces won’t slide over one another - they remain ‘locked’ until the traction reaches a value which, as we learn in school physics, equals the coefficient of friction \(\mu\) times the normal contact force \(N\). Then suddenly, the book moves. Similarly if you place a flat steel sheet across a railway track and try to push it along the rails, as shown in the upper curve of figure 4 there is no relative movement until the traction overcomes the static friction force. But in the case of a rolling wheel, something new happens. It might seem improbable, but as explained in Section R2019, when the wheel applies a traction force to the rail there is an intermediate stage in which the wheel and rail surfaces flow at different speeds through the contact patch. The result is relative motion or creep that blurs the boundary between adhesion (no movement) and sliding (uncontrolled movement). In between, the creep versus traction relationship follows a smooth curve as indicated by the line AB in figure 4. The relationship is linear at first, then breaks down as the traction reaches its limiting value \(\mu N\). At this limiting value, the creep rate is about 0.015, meaning that for every metre of rail surface covered, the total length of wheel tread passing through the contact patch is 1.015 m. In other words, a driving wheel at the limit of traction ‘loses’ about 15 mm for every metre travelled [3].
Figure 4
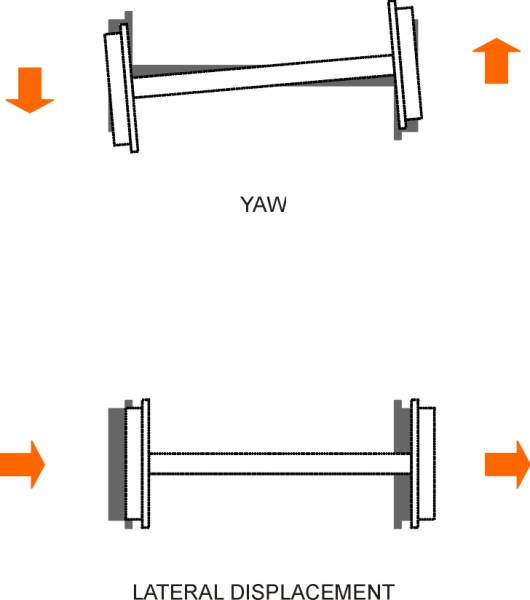
The creep process plays a large part in vehicle stability because it makes the interface between wheel and rail more flexible. Over a sufficient number of revolutions, a wheelset can yaw or swivel away from the ‘ahead’ direction with one wheel moving forward slightly faster than the other (figure 5). It can also shift a little from side to side. This freedom of movement opens up the possibility of unstable oscillations which, as will be seen in Section R0418, dogged railway operations for many years.
Figure 5
Friction and railway management
If you were asked to judge whether a railway was delivering value for money, you might want to think in terms of input and output. The input is the fleet of rolling stock which is expensive to buy and maintain, and the output is passenger kilometres per day, so a good measure of productivity might be the ratio of the two, in other words, passenger-km per train per day. Friction, or rather the lack of it, affects the output because it determines the maximum levels of braking and acceleration, which in turn affect the amount of traffic the line can handle.
Line capacity
For a railway system to be productive you would expect to maximise the total throughput of trains per unit time. To keep things simple we’ll imagine a railway line connecting two terminals with two parallel tracks, one for each direction of flow. All trains move at cruising speed \(u\). We want to make the time headway between consecutive trains on either track as small as possible. Safety considerations demand that the track is split into blocks, and the trains controlled so that at any given time, a block may hold no more than one train. Each block can be a fixed section of track as with a traditional railway system, or it can be a virtual block that moves along with the train as now happens on certain high-speed lines in Europe, for example, but the principle is broadly the same. What matters is the typical length of a block, which we’ll denote by \(L\).
In a simple block system, a train must be able to stop within the length of each block. If we assume for simplicity that all trains travel at the same speed \(u\) and brake at the same deceleration rate \(b\), we can work out the distance needed to stop from the well-known constant acceleration formula
(1)
\[\begin{equation} v^2 \quad = \quad u^2 \; + \;2as \end{equation}\]where \(u\) is the initial speed, \(v\) is the final speed, \(a\) is the acceleration, and \(s\) the distance travelled. In this case, we have for \(a = -b\) (the acceleration is negative), \(s = L\), and since the train is coming to a halt we have \(v = 0\). Substituting these values in equation 1 leads to
(2)
\[\begin{equation} 0 \quad = \quad u^2 \; - \; 2bL \end{equation}\]so that
(3)
\[\begin{equation} L \quad = \quad \frac{u^2}{2b} \end{equation}\]The time taken for a train to pass through a typical block of length \(L\)will be \(L/u\) and this fixes the time interval between trains. Hence
(4)
\[\begin{equation} \text{Time interval between trains} \quad = \quad \frac{u^2/2b}{u} \quad = \quad \frac{u}{2b} \end{equation}\]and the throughput in trains per unit time is equal to the reciprocal thus
(5)
\[\begin{equation} \text{Throughput} \quad = \quad \frac{2b}{u} \quad \text{trains per unit time} \end{equation}\]In other words, the capacity of the track is proportional to the deceleration rate \(b\). The harder you brake, the more passengers you can squeeze through the system. Assuming the brakes are sufficiently powerful, it is the coefficient of friction that determines capacity.
But we have grossly simplified the assumptions on which the analysis is based. In many cases the passenger demand doesn’t justify a high-frequency service. With a time interval of more than 15 minutes between consecutive trains there is no capacity constraint and the braking rate is only relevant insofar as it affects safety. In other cases, the capacity depends not on the headway between trains but on the length of time the trains spend at each station. If there is only one platform per track, and each train spends five minutes at a stop, the capacity cannot be greater than 60/5 = 12 trains per hour irrespective of braking performance. Finally, passengers don’t expect to be thrown about inside the vehicle so in practice, the acceleration rates and deceleration rates are constrained by the levels they will tolerate. As noted in Section G0816, this limits the maximum deceleration to around \(0.05g\) except in an emergency.
Devices for improving grip
Bad weather can hamper railway operation almost as much as it hampers safe movement on roads. Water and ice reduce the coefficient of friction between the wheel and the rail, and the effect is exacerbated by oil, grease, or vegetation. When a freight train halts at the foot of an uphill grade, if the rail is slippery the driver may not be able to get it going again. As we shall see shortly, even passenger trains will flounder from time to time if there are leaves on the line. No amount of tractive power will help because it will make the wheels spin, which (a) causes a reduction in grip overall, (b) damages the rail and (c) risks burning out the motors. The traditional solution is to equip each vehicle with a sand containment vessel: when properly dried, sand can be dropped on to the rail and blown into the contact area under the leading wheels using compressed air. A slippery rail is hazardous for another reason: if a fast-moving vehicle needs to stop suddenly when it meets an unexpected red signal or a hazard on the line, the heavy application of brake force can lock up the wheels. This reduces the grip, damages the rails, and leaves flat spots on the wheels (figure 6) that produce a characteristic thumping sound when the train gets back up to speed. They will need refurbishment.
Figure 6
For both these reasons modern trains are equipped with control circuitry that works rather like the stability enhancement system fitted to an automobile. Each axle is checked at intervals to see whether its speed of rotation is consistent with a pre-determined level. In the case of a driven axle, if it starts to spin, the power is reduced. Alternatively if an axle locks under braking, the braking pressure is reduced. Over the course of the last century, railway engineers have tried more radical measures to improve grip and enhance acceleration and braking performance especially on urban railways where capacity considerations predominate. Perhaps the most remarkable attempt was the Paris Metro: starting in the 1950s, several lines were converted to run on rubber tyres specially developed by Michelin for the purpose. While the practice was taken up in a few other cities, it has not been widely followed, perhaps because the pneumatic tyres have limited life and have proved expensive to replace.
Leaves on the line
A perennial problem for railways in northern Europe is the effect of organic matter on the rail surface. Every autumn, trees that grow alongside the track will shed their leaves, some of which fall across the rail and are ground to a mulch by the wheels of passing trains. The species mainly responsible are deciduous and broad-leaved: ash, lime, poplar, sycamore, sweet chestnut and horse chestnut. Their leaves contain lignin, which bonds to the rail surface to form a coat whose coefficient of friction is close to that of ice. It doesn’t easily wash off. The problem has worsened recently because modern trains are lighter than their predecessors, and the wheels can’t penetrate the lignin film to grip the surface of the rail. Until 2006, the national UK organisation Network Rail relied on a fleet of 32 locos adapted to carry out water-jetting and to apply a mix of gel and dry sand to the track. At the same time, teams of track maintenance staff were deployed to local ‘hotspots’ during the early hours of the morning with hand-held petrol-driven scrubbing brushes, sand-sticks and chemicals. But the autumn leaf-fall still cost the industry £60M per annum, and in 2006 the company announced a fleet of trains with high-pressure water jets operating at 1000 bar, complemented by two ‘Super-soaker’ 1500 bar trains operating on the West Coast Main Line at 60 mph. There also appears to be scope for laser blasters delivering pulses via fibre-optic cable but so far this option hasn’t been taken up in the UK [10]. What has happened is a concerted effort to tackle the problem at source through a 25-year project to manage vegetation where leaf fall has caused particular problems in the past. Arboricultural surveyors are walking much of the UK network using hand-held GPS devices to record individual trees together with their leaf fall. They are also planting new trees with ‘rail-friendly’ leaves further away from the track, and when these mature, the old ones will be removed [1].
Conclusion
For a train running at any given speed, the coefficient of friction between the wheels and the rail determines how quickly it can stop, and therefore the minimum time gap needed between vehicles for safe operation. Unfortunately, the driver can’t rely on a guaranteed value, because it varies over a wide range depending on the weather and the extent to which the rail happens to be contaminated: the railway timetable must be configured to allow for greater stopping distances than are needed in dry weather on freshly-laid track. On mainline railways, trains are kept a long way apart, with minimum time headways of about 5 minutes between consecutive services depending on speed. But for some urban light rail services with time headways of the order of two minutes or less, the maximum braking and acceleration rates influence throughput, and the level of friction may have a direct effect on capacity. The most critical conditions occur on urban tramways, where rail vehicles mix with other traffic. A tram must be capable of emulating the braking performance of a road vehicle with pneumatic tyres, and it has a crude but effective way of doing it - two steel shoes that drop onto the rail and press down hard so the tram skids to a halt.
Acknowledgement
Figure 1: Brunton’s ‘Mechanical Traveller’, source: Sinclair, A (1907) Development of the Locomotive Engine, New York: Andrew Sinclair Publishing Company, see p481.
10 November 2014