R.1416
Aerodynamics and the moving train
In October 1964 a new rail passenger service opened between Tokyo and Osaka in Japan: the Shinkansen line. The trains travelled at 210 km/h (130 mph), faster than many thought possible at the time. The cab front was shaped like a jet airliner, with an aerodynamically rounded nose that gave rise to the nickname ‘bullet train’. To an engineer, maybe, the shape wasn’t surprising because at high speeds, aerodynamic drag accounts for much of the total resistance to the movement of any vehicle, and a rounded nose seemed likely to help. It would set the pattern for years ahead. But since then, fashions have changed: the current N700 Series Shinkansen trains don’t look like aircraft at all. In this Section, we explore the application of aerodynamic science to trains, and try to explain why railway trains are evolving in a rather different direction.
Streamlining
The bullet train, although way ahead of its time, was not the first rail vehicle with a smoothly curved profile. Before the Second World War, in the face of growing competition from the private car and the emerging national airlines, railway companies invested in what people used to call ‘streamlining’. Particularly in the USA, leading designers such as Raymond Loewy and Henry Dreyfus were commissioned to re-style the locomotives and passenger coaches used for luxury express trains. Inspired by the airfoil and fuselage shapes being developed for aircraft, they produced some of the most visually exciting designs ever applied to a railway vehicle, and they continue to stir the imagine three quarters of a century later. Let’s look at some examples.
Some classic designs
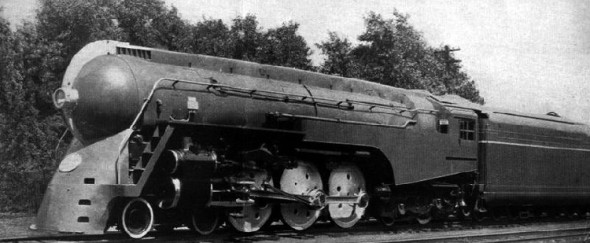
Our first example is the 1938 J3-a Hudson Mercury that operated the Twentieth Century Limited service between New York and Chicago. Basically a conventional steam locomotive, the Mercury was shrouded in a steel casing by industrial designer Henry Dreyfus. Its most striking feature was the front end: a bullet nose to smooth the airflow over the front of the boiler together with an apron wrapped around the leading wheels. The whole was punctuated by a fin leading up from the central headlight to the funnel (figure 1). Whether the fin served any functional purpose I do not know, but the visual effect was striking.
Figure 1
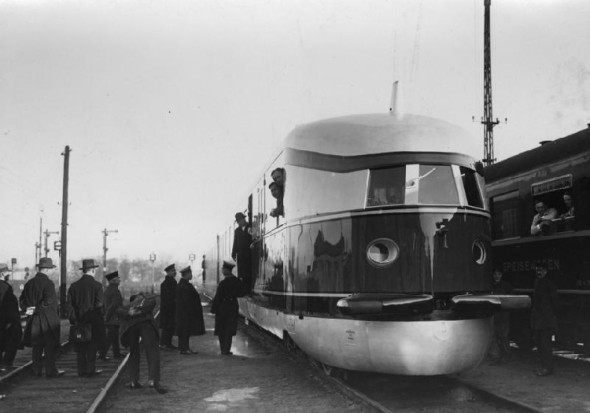
In contrast to the J3-a was the 1933 Fliegender Hamburger (‘Hamburg Flyer’), a prototype two-car set designed to run between Berlin and Hamburg at an average speed of 124 km/h, faster than any other train at that time (figure 2). Compared with the Mercury, the design was visually restrained, giving little hint of the power available from the 12-cylinder Maybach diesel engines, one at either end. Like the Rumpler automobile of 1921 (see Section C1416, Figure 7), the whole was encased in a smooth envelope with a vertical emphasis, like a shark’s fin or a submarine conning tower.
Figure 2
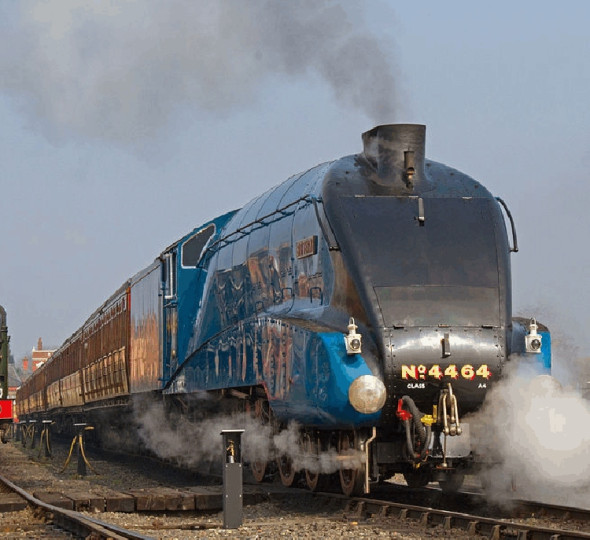
For our third example, we’ll take the A4 series of steam locomotives designed by Sir Nigel Gresley in the mid-1930s. Figure 3 shows the Bittern (its sister vehicle, the Mallard, broke the world speed record in 1938). The distinctive shape of the side fairings over the driving wheels echoes the cross-section of an aircraft wing, but more important from the aerodynamic point of view is the wedge-shaped fairing over the front of the boiler. With a stretch of the imagination this might be seen as a forerunner of the 1970s sports car.
Figure 3
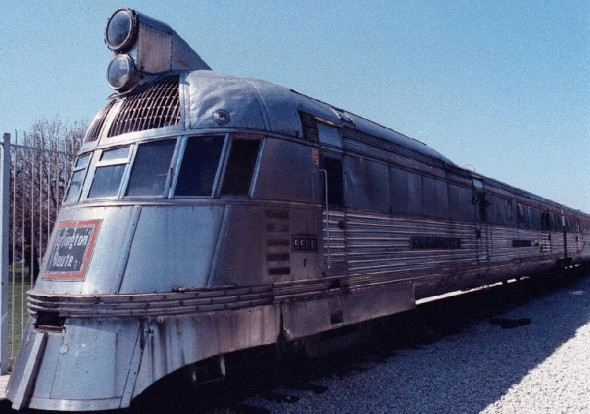
Finally, we turn to another diesel, the Zephyr, which was built for the Chicago, Burlington and Quincy railroad in 1934 (figure 4). It was an advanced vehicle for its time, having a body shell built up from stainless steel sheet, spot-welded like an automobile to form a comparatively lightweight but rigid structure. Like all US locos, the Zephyr was given a skirt to protect the leading bogie from impact should an animal stray onto the track. Here, the skirt and the driver’s windshield were integrated into the nose so that together they formed a simple convex profile.
Figure 4
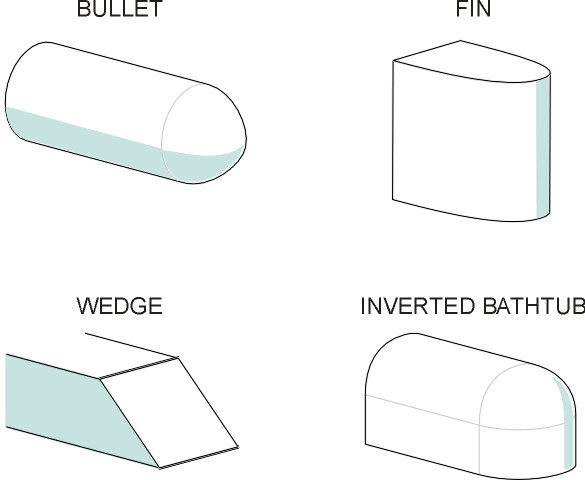
These four machines represent four basic shapes that that we’ll call the bullet, the fin, the wedge and the bathtub (figure 5). Which was the best shape? Surprisingly perhaps, there was little to choose between them. Wind-tunnel tests at the UK National Physical Laboratory showed that streamlining could indeed reduce drag, but only at speeds above the normal operating speeds of that era [16]. Streamlining certainly helped to deflect smoke upwards and away from the sides of a steam loco, for example on Nigel Gresley’s A4 designs, and on Raymond Loewy’s 1937 K45 (not shown here). But the wedge profile of the A4 raised its top speed by only a few kilometres per hour. The fact is that for steam locos, a streamlined shroud added weight and hindered maintenance to such a degree that after 1945, most of the shrouds were removed [14].
Figure 5
Air resistance
At first sight, this seems paradoxical: we know that in the case of the automobile, streamlining can reduce drag at motorway speeds potentially by a half. Why not the same for trains? The answer lies in the fact that a railway train is long and thin compared with an automobile, which is short and squat. Much of the car’s wind resistance comes from the difference in air pressure across the front of the vehicle compared with the air pressure acting over the rear, in other words, ‘form drag’. It can be reduced by tapering the body profile towards the rear so that the boundary layer of moving air clings to the sides and roof over a greater length before ‘breaking away’ to leave a low-pressure region in the wake (see Section C1416). This doesn’t work with a railway train, for two reasons. Firstly, the thickness of the boundary layer increases along the length of the train and by the time a parcel of air reaches the rear it doesn’t contain enough energy to overcome an adverse pressure gradient. It can’t be prevented from breaking away, and therefore the shape of the rear has little effect on drag [5]. Secondly, for a railway train, the form drag is almost irrelevant. Most of the air resistance comes from the friction of air sliding underneath, around the sides, and along the roof of the passenger coaches, whose total surface area is large compared with their cross-sectional area, which is only about 10 m2 [10].
So how much drag might one expect? Let’s examine the formula for total resistance that was quoted for the Shinkansen 0 Series in [12]:
(1)
\[\begin{equation} D \quad = \quad \left( 1.2\; + 0.022 V \right) W \; + \; \left( 0.013 \; + \; 0.00029l \right) V^2 \end{equation}\]where \(D\) is the total resistance - including mechanical resistance - in units of kgf, \(V\) is the speed of the train in km/h, \(W\) is the total weight of the train in tonnes, and \(l\) is its length in metres. It is the second term that embodies the aerodynamic drag, which, as we’d expect from aerodynamic theory, is proportional to \(V^{2}\) (see Section C1416). At a speed of 200 km/h, for a train of length 400 m, its value comes to about 5200 kgf or 5.2 tonnes, and it accounts for roughly two thirds of the total resistance. If the speed were increased to 300 km/h, it would more than double, accounting for nearly 80% of the total. Much of it comes from the flow of air underneath the body and around the bogie units, whose rough surfaces and sharp corners produce a great deal of turbulence.
Resistance is important because it determines the energy consumption and the power required from the motors, and the formula shows that at high speeds on level track, it’s the aerodynamic component that really matters. In general terms, the energy required to overcome aerodynamic resistance during a journey of length \(L\)is equal to the force times the distance travelled, and hence proportional to \(V^{2} L\). Neglecting other forms of resistance, if you double the speed, you consume four times the fuel. And the rate of energy consumption per unit time is proportional to \(V^{3}\), so that other things being equal, you need motors that are eight times as powerful. To summarise:
- aerodynamic drag increases sharply with increasing speed,
- with the speeds now being routinely achieved on modern railways, aerodynamic drag outweighs all other forms of resistance and therefore dominates the energy balance sheet, and
- most of the drag comes from the bogies and the main body of the train, not the front or rear.
So what can the engineer can do to save fuel, or to put it the other way round, for a given fuel consumption, how can one make the train go faster? The key is a smoothly continuous body surface, and the shape of the nose is relatively unimportant. As we shall see later, the exotic profiles that are now appearing on high-speed railway tracks around the world have to do with something else entirely.
The pattern of flow
In reality, a formula such as equation 1 has limited value, because it refers to ideal conditions in which the air flow meets the vehicle head on, whereas even in a gentle breeze, it will arrive at an angle to the train’s longitudinal axis. The wind yaw angle is not normally zero. To this extent, the railway train resembles a motor car, which spends most of its working life moving through a cross-wind of greater or lesser proportions. The difference is that in the case of a railway train, the area of the side panels is enormous compared to the frontal cross-section, so a non-zero yaw angle implies a major change in aerodynamic behaviour.
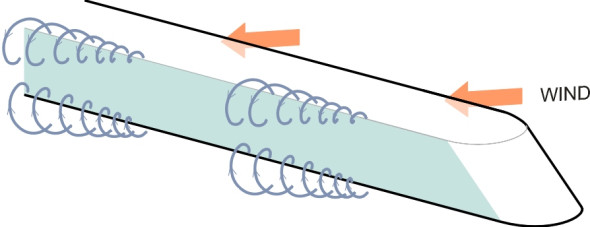
This raises two questions: (a) could an extreme wind gust overturn a moving train, and (b) how does a cross-wind affect the aerodynamic drag? Ideally, to answer these questions one would set up an experiment to measure the forces created by different levels of cross-wind on a moving train. But this is far from easy. Nor can the effects be simulated in the laboratory, because a scale model that’s sufficiently large to resolve the pattern of air flow as it angles underneath the body and across the roof would be too long to fit into a wind tunnel. But computer simulation [1] suggests that the wake in cross-winds takes on a distinctive pattern, with vortices inclined at an angle to the direction of motion as shown in figure 6, together with a suction pressure peak on the windward roof corner. Further information can be found in [4]. Fortunately, the results suggest that a cross-wind is unlikely to blow the train over even at very high speeds. On the other hand, it can produce an appreciable increase in drag [9], and in practice, therefore, the energy consumed by a moving train will vary with weather conditions and the extent to which the train sheltered from lateral winds by the landscape through which it is travelling.
Figure 6
Aerodynamic noise
All transportation vehicles are noisy to a greater or a lesser degree. A hundred years ago, if you lived near a railway you’d hear locomotives puffing, the clanking of freight wagons, and an occasional whistle. Then came the singing wheels and rails. Today, we have a new phenomenon, the aerodynamic ‘whoosh’ of the high-speed train. Aerodynamic noise comes from the turbulent flow of air over the body surface within the boundary layer. Within this layer, small eddies throw off acoustic energy, and the resulting noise dominates all other sources at speeds over 300 km/h [15]. Exactly where the acoustic energy comes from is not obvious, and calls for a little explanation.
How is it made?
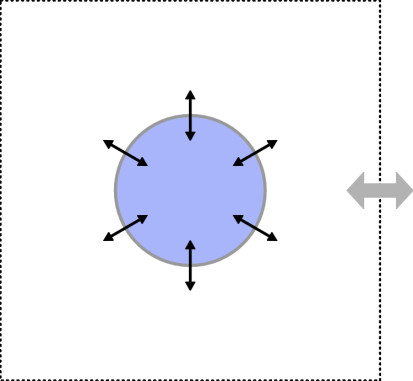
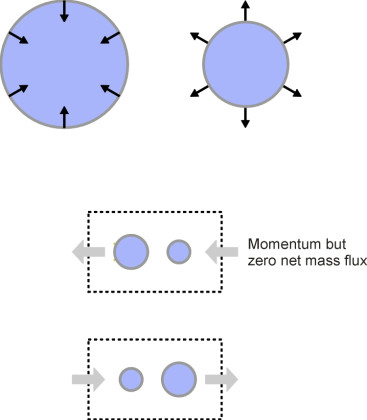
All sounds are driven by motion of some kind, motion which forces the air between the source and the listener to pulse or vibrate. The forcing mechanisms fall into three different categories. A typical hi-fi speaker consists of a lightweight diaphragm stretched across the front of a sealed cabinet. When you turn on the radio or play a CD, the diaphragm oscillates to and fro at high speed, thereby creating pressure pulses that reproduce the sound of music when the waves reach your ear. In physical terms, the loudspeaker is a monopole, often represented as a sphere that distends and contracts so that it radiates sound in all directions (figure 7). Imagine a fixed envelope - an imaginary box - placed around it. The monopole is distinguished by the fact that it swells and contracts so that a small but finite mass of air crosses and re-crosses the envelope as each wave is radiated away from the source into its environment (figure 8). At each instant there is a net mass flow either inwards or outwards. This mass flux is represented by a particular term in the equation that governs the conservation of momentum for the system as a whole (a fuller description can be found in [6] or [7]).
Figure 7
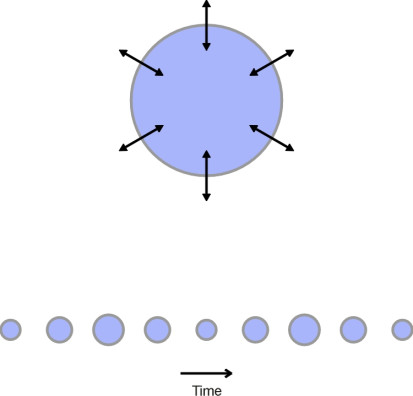
Figure 8
Other objects don’t change their volume at all, but simply move to and fro. The musical tuning fork is a good example. Let’s focus on one of the blades and imagine it vibrating from side to side. You can’t draw a box around blade and observe a mass of air entering and leaving the box, because the blade pushes air away on one side while simultaneously drawing it in on the other. The mass pumped out by the compression wave is balanced by the mass drawn in by the dilatation wave, and the instantaneous mass flux is zero. This kind of source is called a dipole, and what distinguishes it from a monopole is that it forces the momentum of the air around it to vary without changing the mass flux at all. First it pushes the air one way, and then the other, so its momentum rapidly changes sign. The waves on opposite sides are beamed in opposite directions, which gives the dipole a strongly directional bias. But they partially cancel one another out where they curve around the sides of the blade, which by comparison with a monopole makes the dipole less effective at converting mechanical motion into sound. The dipole can be pictured as a pair of monopoles placed close together and vibrating 180\(^\circ\) out of phase as shown in figure 9. While one expands, the other contracts, and vice versa.
Figure 9
Lastly, there is a third kind of source called a quadrupole. This is a more elusive concept, because as we’ll explain in a moment, the quadrupole doesn’t involve an external agency at all. It can be represented as a set of four monopoles arranged in the form of a square, with their phases opposed as shown diagrammatically in figure 10 (it’s not the only possible arrangement but that needn’t concern us here). The quadrupole produces no mass flow, and because the momentum produced in one direction by two of its monopoles is balanced by momentum in the opposite direction produced by the other two, there is no overall momentum variation either. At the mathematical level, within any fixed envelope both the total mass and the total momentum remain constant. But momentum still crosses the envelope, arriving in some places while departing at others, and it is the rate of momentum flux that changes. It’s a different term in the equation.
Figure 10
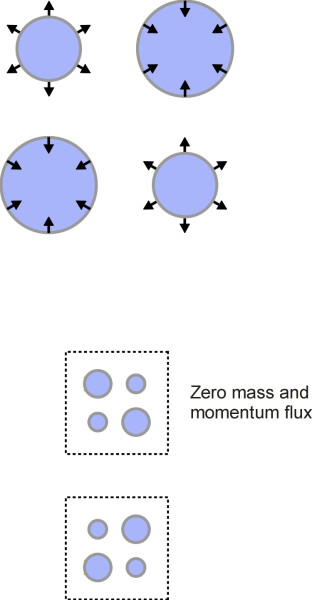
How are quadrupoles formed? The process takes place within the body of air itself, in the form of turbulence that radiates some of its energy as sound. As the name implies, in turbulent flow, individual chunks of air do not follow smooth streamlines, but curl up into eddies of differing size, each a spinning vortex shaped roughly like a rugby ball, and each acting as a quadrupole that radiates sound in all directions. Since there is no mechanical ‘forcing’, (no strings or sound boards to stimulate the air into motion) the intensity is low. And because the eddies are of widely differing size, the frequency of noise is spread over a wide spectrum with the emphasis on no particular frequency or musical tone. When the wind blows, what we hear is a hiss or a roar.
Noisy trains
For many years, wind noise remained a mystery. Engineers didn’t worry about it because vehicles didn’t travel fast enough for it to become a nuisance. In fact the mechanism was explained only when the jet turbine was used to power commercial aircraft after 1947. It’s the turbulence within the exhaust stream that’s responsible for the roar of a jet engine, usually at its greatest when the pilot opens the throttle ready for take-off. It has taken a great of research to contain the problem to something approaching a manageable level, including the development of the turbine by-pass and the turbo-fan. Nowadays, the emergence of high-speed railway trains has once more brought aerodynamic noise into the public arena, and with continually rising speeds, the problem will become increasingly difficult to resolve.
Why? Having worked our way through the monopole, the dipole and the quadrupole, we can piece together an explanation. Theoretical analysis [7] has shown that the sound intensity generated by a quadrupole rises very quickly with air speed \(V\), being proportional to \(V^8\). If you double the speed of a turbulent air stream, the noise intensity rises by a factor of 256. In stark terms, it makes over 250 times as much noise. For a high-speed train, the rate of increase is not quite so severe, because the dominant noise source lies within a particular part of the boundary layer. It’s not the eddies themselves, but their interaction with the rigid surface of each body panel, which has been shown to behave like an array of dipoles [2]. For a dipole, the noise intensity increases as the 6th power of speed of the air flow within the boundary layer, as opposed to the 8th power in the case of the quadrupole. So when the speed of a train doubles, the aerodynamic noise increases by a factor of 64. This is still a sharp increase, and the implications are not difficult to foresee. For anyone living near a railway line, higher train speeds will bring a new form of disturbance into their lives.
Pressure waves
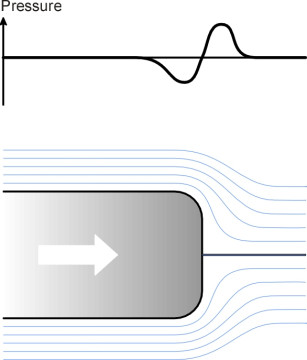
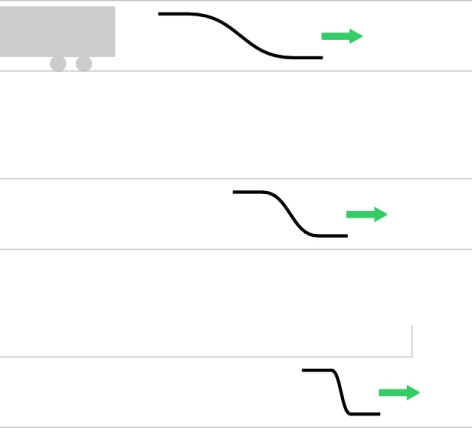
The disturbance created by a train is not limited to aerodynamic noise. Any moving vehicle must penetrate the atmosphere surrounding it, and the air flow approaching the nose undergoes first a rise in pressure then a fall as it accelerates around either side (figure 11). The pressure changes are important for high-speed trains, some of which are now operating at around 300 km/h. The result is that when two trains pass in opposite directions, each experiences a pressure rise on the body shell of the leading coach. Pressure variations arising from aerodynamic interference between a train and its surroundings or between two trains passing in opposite directions are of the order of 2 kPa, about 2% of atmospheric pressure. This doesn’t sound much, but the sudden rise can be unpleasant for passengers and when acting over a large area of bodywork, it can rock the vehicle on its suspension.
Figure 11
Pressure waves in tunnels
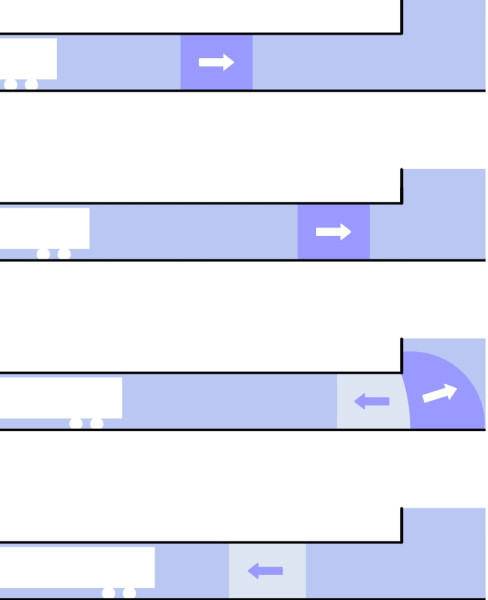
Pressure changes also occur when a single train enters a tunnel, but they follow a more complex pattern. First, the train acts like a cork entering a bottle neck: it compresses the air ahead, and this adds to the aerodynamic resistance. Second, the air doesn’t allow itself to be pushed along the tunnel. Instead, it moves in the opposite direction, squeezing through the gap between the train and the tunnel walls so that the velocity of the boundary layer increases. Hence the friction drag rises as well. Thirdly, by squeezing the air in the tunnel entrance the train creates a compression wave that travels ahead at the speed of sound. there’s nothing mysterious about this. All mechanical actions involve a small delay between cause and effect. When you strike a nail with a hammer, not all the parts of the nail move at the same time: the tip doesn’t ‘know’ about the hammer blow until the impact has been propagated along the billions of molecules that separate it from the nail head, a process that takes place at finite speed. Likewise, the air pressure ahead of a railway train doesn’t rise immediately at all points along the tunnel. The increase is propagated as a wave front that takes a finite time to cover the distance to the exit. The intensity of the wave depends partly on the speed of the train and partly on the clearance between the sides of the train and the tunnel wall, so the effects are less severe for tunnels of larger diameter.
When the compression wave reaches the far end of the tunnel, it is reflected as shown in figure 12 and returns in the opposite direction as a low-pressure wave to meet the oncoming train [3] [17]. You may find this surprising: surely it should vanish into the open air because there is nothing for it to bounce off? But the phenomenon is well known to musicians. All wind instruments resonate even though they have one end open to the atmosphere. The explanation lies in the fact that an air column is springy and it has mass - not very much but enough to support a wave. Think of the air column in a tunnel as a series of small weights. The weights are joined to their neighbours with springs so that they resist being squeezed together and they resist being pulled apart. You can send a pulse along the chain, and each weight will nudge its neighbour in turn until the pulse arrives at the far end. If the end is closed, the last weight cannot move and when pushed by the penultimate weight it will simply return the push via the connecting spring so that the pulse returns along the chain in the opposite direction. But if the end is open, there is little resistance: the last weight is catapulted almost out of the tunnel. But it is still attached to the penultimate weight and since it can’t drag all of them out together it gives its neighbour a sharp tug via the spring and remains at the end of the tunnel. The tug is passed in turn to the previous weight in the chain, and in this manner the wave is reflected back along the tunnel whence it came. But this time we have a negative pulse: it has changed sign, indicating a pressure trough rather than a pressure rise. The pulse can in principle be reflected and re-reflected several times, bouncing backwards and forwards and changing sign each time it reaches the tunnel exit [3].
Figure 12
With the continuing trend towards higher speeds, the pressure variations that arise in tunnels can reach 7.5 kPa, which squeeze and distend the train body shell, potentially causing structural damage. They can also disturb passengers, and it is partly for this reason that modern trains are ‘sealed’ from the atmosphere. This doesn’t reduce the amplitude of the variations themselves, which can only be achieved by making the tunnel larger. Some tunnels consist of a single bore with trains passing one another in opposite directions along parallel tracks, and for tunnels of this kind, the recommended tunnel cross-section rises from 40 m2 for an operating speed of 160 km/h to 100 m2 at 300 km/h [11]. Others such as the Channel Tunnel consist of two separate bores, one for each direction, and in such cases, the cross-sectional area of the train represents a larger proportion of the cross-sectional area of the tunnel and the pressure wave phenomenon tends to be more severe. But its impact is reduced if there are ventilation shafts linking the two bores at frequent intervals, which allow the pressure wave to dissipate. Unfortunately, however, this is not the end of the story.
Sonic boom
In Japan, because of the mountainous territory, a high proportion of the railway network lies underground. Some of the tunnels are more than five kilometres in length, with densely populated valleys at either end. When high-speed trains were first introduced, engineers were surprised at the result. From time to time, a loud bang would issue from a tunnel exit that greatly disturbed residents living nearby. There was no warning [18].
The problem was traced to the arrival of the compression wave travelling ahead of each train. The compression wave moves at the speed of sound, which for a 7 km long tunnel means that it arrives at the exit about a minute before the train appears. Now the shape of the compression wave when it is first created depends partly on the speed of the train. If the train is moving slowly, the pressure rise is small and the wave front has a gentle slope (the pressure rises gradually). But as figure 13 shows, it changes its shape as it travels along the tunnel, especially if the track is laid on a concrete slab rather than conventional ballast. Because the speed of sound in air increases slightly with air pressure, the trailing edge of the compression wave, where the pressure is higher, travels slightly faster than the leading edge [19]. The wave is squeezed from the rear as it were, leading to an increasingly steep profile. If the initial wave has a shallow slope, as in the case of a slowly-moving train, or if the tunnel is short, the energy will be dissipated without any ill effects when it reaches the exit. But if the initial wave is steep and the tunnel is a long one, the slope will increase until it becomes almost vertical - a shock wave. At the tunnel exit, the sudden pressure rise is transformed into a pulse, a ‘micro-pressure wave’, that resembles the boom generated by an aircraft in supersonic flight. The amplitude is roughly proportional to the slope of the compression wave and inversely proportional to distance from the tunnel exit [8] [13].
Figure 13
The bottlenose
In principle, the sonic boom can be alleviated by reducing the slope of the compression wave that produces it. This means increasing the diameter of the tunnel at least for the first few meters inside the tunnel entrance where the compression wave itself is created. In many cases it is cheaper to build a ‘hood’ outside the existing entrance, flared to contain the rate of pressure growth. It’s also helpful to modify the nose of each train. A preferred shape has emerged during the last decade. Referred to as the ‘bottlenose’, it is basically a very long wedge that permits a more gradual build-up of pressure, particularly where it merges with the main body of the vehicle. A good example is the nose of the Talgo 350, the Spanish high-speed train that first went into service in 2005 (figure 14). Another example is the Japanese N7000 series, whose prototype appeared in the same year. It is pictured on the title page of this Section. In both cases, what we are seeing is not ‘streamlining’ in the old-fashioned sense of the word, but a profile designed to get the vehicle through tunnels with the minimum possible disturbance both to passengers and people in the surrounding area. It is streamlining for quietness, not speed.
Figure 14
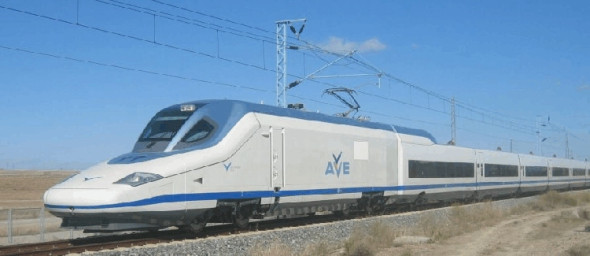
Figure 15
Conclusion
A transport system that can move people and goods at 350 km/h without leaving the ground is an exciting prospect. In some countries it has already arrived. Passengers can travel from city centre to city centre almost at airline speeds without the bother of going to the airport, checking in, or queuing at the security barrier. But air resistance increases as the square of the speed, and to keep the fuel cost down, a high-speed train must be aerodynamically efficient. This doesn’t mean it should look like an aircraft. Compared with the fuselage of a passenger jet, the typical railway train is long and thin, more like a knitting needle than a teardrop. The shape of the front and rear are almost irrelevant. What matters is size and smoothness: it’s the friction between the boundary layer and the considerable surface area of the passenger coaches that creates most of the drag. Nor is drag the only concern. Aerodynamic noise increases with the 6th power of speed, which raises the prospect that if the present trend continues, railway lines could become a noise nuisance comparable with that of motorways and airports today.
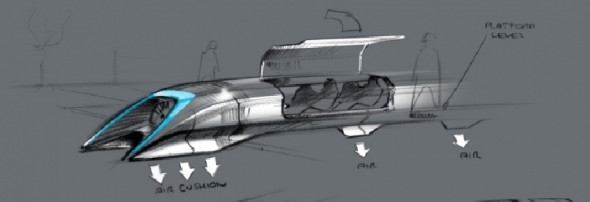
So what can be done to make trains quieter? Broadly speaking, the designer tackles aerodynamic noise in the same way as aerodynamic drag: by concentrating on the features that trigger turbulence, and indeed any discontinuity in the body shell. The most effective measures are likely to include a shield to deflect oncoming air away from the pantograph, fairings between the coaches, and a skirt along the sides of each coach to reduce air flow into the region occupied by the bogies and wheels. Other things being equal, the fewer the bogies, the less the drag and the less the aerodynamic noise, so it’s a good idea to articulate the layout with each bogie shared by two neighbouring coaches (we’ll return to this question in a later Section). In this sense, the aerodynamic design of rail vehicles will boil down matters of detail. Apart from the bottlenose we won’t see spectacular new shapes of the kind that appeared in the 1930s, when streamlining first became fashionable. Unless, that is, some radically new form of transport emerges such as the evacuated tube proposed by Elon Musk, founder of the aerospace company SpaceX. He envisages passenger capsules propelled by a combination of fans and electromagnets at speeds of 1000 km/h or more on an air cushion inside a welded steel tube from which the air has been partially removed to reduce drag (figure 15). You can find details on the company website [20] listed at the end of this Section.
Acknowledgements
Figure 1: The J3-a Hudson steam locomotive with shroud designed by Henry Dreyfus. Source: New York Central Railroad, available at http://commons.wikimedia.org/wiki/File:Mercury_Hudson_locomotive.jpg, accessed 26 July 2021.
Figure 2: The Hamburg Flyer. Source: Bundesarchiv, copyright Creative Commons, available at https://commons.wikimedia.org/wiki/Category:DRG_Class_877#/media/File:Bundesarchiv_Bild_102-14151,_%22Fliegender_Hamburger%22,_DRG_778.jpg, accessed 27 July 2021.
Figure 3: Sir Nigel Gresley’s A4 steam locomotive, the Bittern. Author: Tony Hisgett, copyright Creative Commons, available at https://commons.wikimedia.org/wiki/File:4464_Bittern_at_Kidderminster_(3).jpg, accessed 27 July 2021.
Figure 4: The Zephyr. Author: Charles Peirce, copyright Wikimedia Commons, available at https://en.m.wikipedia.org/wiki/File:Pioneer_Zephyr_Front.jpg, accessed 27 July 2021.
Figure 14: Talgo 350. Author: Peter Christener, copyright Creative Commons, available at http://en.wikipedia.org/wiki/File:Talgo_350.jpg, accessed 27 July 2021.
Figure 15: The Hyperloop concept. Copyright Tesla Motors, available at https://www.tesla.com/sites/default/files/blog_images/hyperloop-alpha.pdf)
21 November 2014