C.1416
Aerodynamic forces
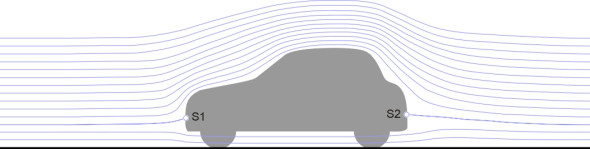
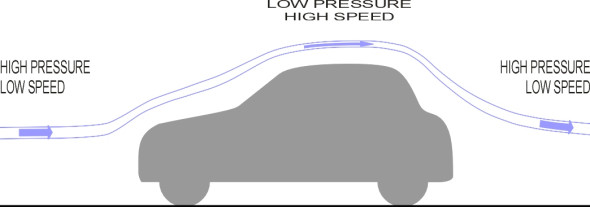
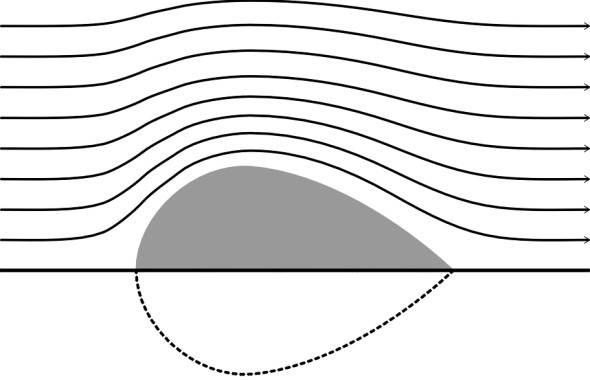
From time to time advertisements appear showing a car in a wind tunnel, with trails of smoke flowing smoothly over the body. The smoke trails indicate ‘streamlines’ in the pattern of flow as shown in figure 1, and they carry a message: this car slips through the air with ease. In reality, the air flow is three-dimensional, with a messier and more complex structure than figure 1 might suggest. Most cars experience a great deal of air resistance, far more than the theoretical minimum for an aerodynamically efficient body of the same overall size. Our aim in this Section is to show how the reality falls short of the ideal, and what manufacturers are doing about it.
Figure 1
Streamlining
Other things being equal, if you are buying a car you will want it to look to look fast and powerful, and while fashions change from year to year, manufacturers have always used styling to create an impression of speed. Let’s begin by asking how the shape of the car has evolved through different phases in pursuit of aerodynamic efficiency.
Early landmarks in aerodynamic design
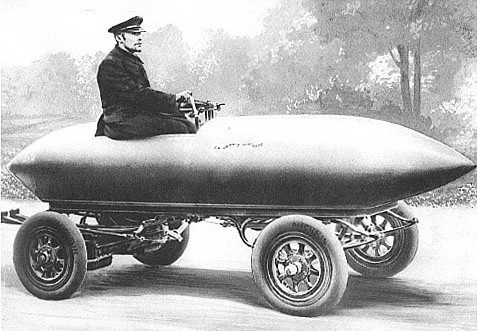
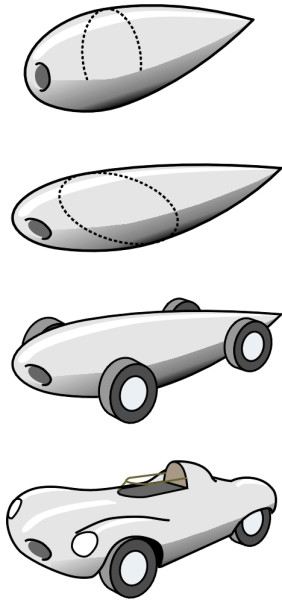
Early car constructors didn’t worry much about aerodynamic design because their machines didn’t go fast enough for the air resistance to matter. The car was essentially a box to carry people, loosely based on the horse-drawn carriage of the late nineteenth century. The supporting chassis carried the passenger cabin together with the engine compartment, wheels and fenders (mudguards) almost as separate entities. But there were notable exceptions. It was known that a ‘teardrop’ shape with a rounded nose and a long, pointed tail was aerodynamically efficient (figure 2), and several racing cars and record breakers were built with a fuselage shaped more-or-less in this form to minimise air resistance (figure 3). The name ‘teardrop’ is perhaps misleading because in free fall, a drop of water will flatten into a disk at right angles to the air flow. So we’ll call our ideal form the ‘zeppelin’ after the German count who pioneered airship design during the early 20th century.
Figure 2
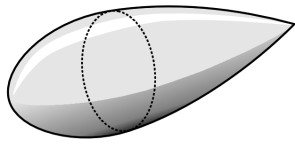
Figure 3
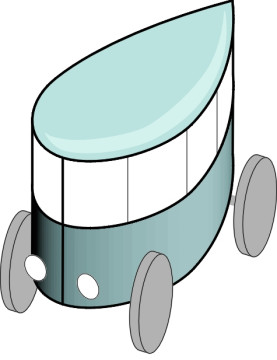
It happens that a circular cross-section is not very convenient for a passenger vehicle because it doesn’t have a flat floor, but the zeppelin outline can be used in a different way, as a body of constant cross-section that stands upright like a shark’s fin, with the airflow dividing symmetrically along either side. It must be quite a stubby fin, thick enough to accommodate a passenger cabin. In 1921, Austrian aeronautical engineer Edmund Rumpler used this as his template for the world’s first systematically ‘streamlined’ vehicle. A simplified representation of his Tropfenwagen or ‘drop car’ is shown in figure 4. It was aerodynamically efficient, more so than most saloon cars of the 1980s [10], but it was not a commercial success.
Figure 4
The four-door saloon
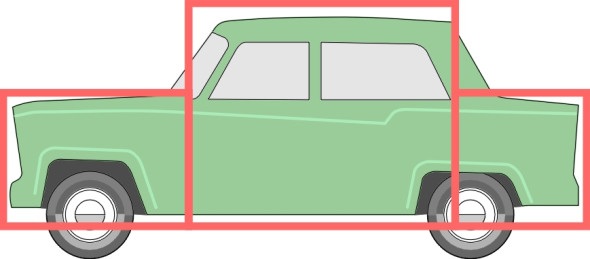
Revolutionary designs have rarely appealed to the motoring public, whose tastes are largely conservative, and it was many years before aerodynamically efficient bodywork became acceptable. During the 1920s, what mattered was a large hood and radiator grille because they signalled a powerful engine. The fenders that housed the front wheels tapered gracefully along either side of the passenger cabin, later evolving into something more like the wheel-covers on a high-performance aircraft (figure 5). The association with aircraft was important: ‘streamlined’ body contours suggested minimal resistance and greater speed. During the 1960s, the body contours changed: the family saloon assumed a ‘three box’ configuration with the wheels fully enclosed (figure 6). It was followed by the ubiquitous hatchback. In principle, an all-enclosing envelope ought to reduce air resistance, but neither were very efficient, and styling conventions sometimes made matters worse.
Figure 5
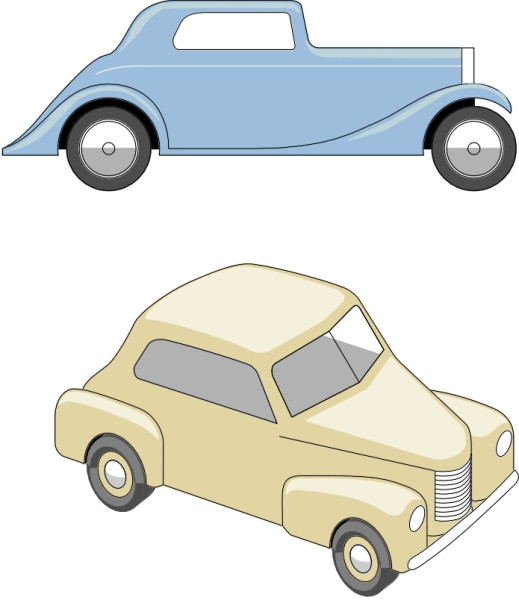
Figure 6
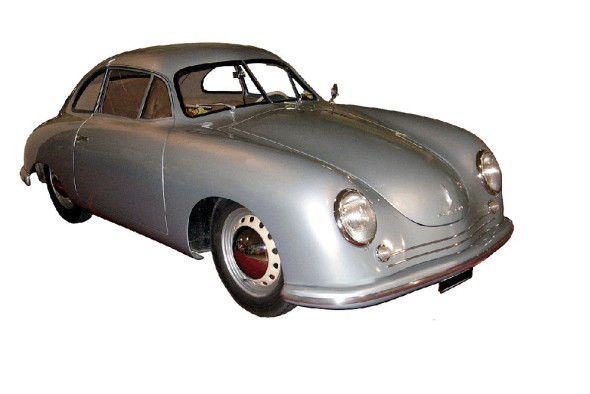
Sports cars
Of course there were sports cars too, low and sleek like the 1950s Porsche series of rear-engined machines. With an all-embracing body shell like an upturned bathtub that almost hid the wheels, they seemed the epitome of aerodynamic refinement (figure 7). A little later came the D-type Jaguar competition sports car. It was an interesting project because the design was based on logical principles throughout. The starting point for aerodynamicist Malcolm Sayer was the classical zeppelin shape to minimise air resistance or ‘drag’. We have to imagine the nose pierced with a circular orifice to supply cooling air to the engine (figure 8). The zeppelin skin was then stretched over the car chassis with the smallest possible surface area to minimise aerodynamic friction. The cross-section together with the radiator intake became an ellipse, and the corners were faired over the wheels and around the driver’s upper body. At each corner, the wheel arches were cut out with the smallest possible area to discourage the air flow from interaction with the wheels.
Figure 7
The result was a graceful design that turned out not to be as efficient as one might expect. The drag coefficient (a measure of air resistance that we’ll return to later) was 0.49, much higher than the figure of 0.28 attributed to the 1921 Tropfenwagen. Like many other sports cars of the day, the body was said to generate a certain amount of lift at the rear axle, and a fin was added to the prototype to improve directional stability. Nevertheless the car performed well on the racing circuit and had a long and successful career almost without modification until the company ceased to produce racing machines.
Figure 8
During the 1970s, the rounded form of the classical sports car was overtaken by a shape that is still familar today: the wedge (figure 9). The aim was to lower the nose to discourage air from flowing under the body, which together with a high tail, helped to provide downforce so the wheels gripped the road better at high speeds (a topic we’ll return to later). It also reduced friction with the rough under-body surfaces, wheels, and suspension. The cooling duct was close to the ground where the air pressure at the front of the car was highest, an arrangement that allowed a small duct with minimum associated drag.
The treatment of the tail was cursory. On a racing machine, a long tail adds weight, increases aerodynamic lift over the rear axle, and is prone to damage, so the potential saving in drag isn’t worthwhile. But you will have noticed from figure 9 that the front wheel housings and the driver’s cabin break up the outline so that no part of the vehicle body actually presents a totally wedge-shaped profile to the oncoming airstream. Nevertheless the concept was more closely in tune with aerodynamic reality than its predecessors and as such marked a turning point the evolution of vehicle body design.
Figure 9
Aerodynamics
Air flow over a moving vehicle affects its behaviour and performance in several ways. At one level, it determines how dirt splashes around the sides of the body and across the rear window, and it determines the amount of wind noise, which can be distracting for passengers when travelling at motorway speeds. At another level, it creates forces that interfere with the car’s motion. Even at a modest cruising speed of 80 km/h (50 mph), provided the car is travelling on a straight, level road, aerodynamic forces swamp all the other influences such as rolling resistance.
Aerodynamic forces
All aerodynamic forces act on a vehicle through boundary layer, the thin layer of air closest to the body surface. The boundary layer is of special interest because it behaves differently from the bulk of the air around the vehicle, being slowed down by friction. Since there is mixing between the surface layer and neighbouring layers, the friction ‘drag’ permeates some distance into the surrounding air stream.
To understand what is going we can picture the air stream (a) moving smoothly in aggregate over the surface of the vehicle but (b) when viewed through a microscope, the molecules dart randomly in all directions within the aggregate. It is the cumulative impact of individual molecules within the boundary layer that produces the aerodynamic forces. The impacts of the molecules act on the vehicle surface in two distinct ways. Each impact has firstly a component parallel to the skin, and the cumulative effect is a shear stress whose value varies in magnitude and direction everywhere around the envelope (figure 10). You can think of it as surface friction.
Figure 10
Secondly, each impact has a component acting at right-angles to the surface, and the cumulative effect is a normal pressure that like the skin friction varies everywhere in magnitude around the envelope (figure 11). The variation arises from the narrowing of the space occupied by each parcel of air as it moves around the vehicle body, which acts as an obstruction. We think of the air stream as a collection of tubes arranged parallel to one another in the direction of flow. When a tube curves around a vehicle body it is squeezed by its neighbours into a smaller cross-section (figure 12). The air, which is more-or-less incompressible at road traffic speeds, must flow faster as it passes through the constriction. We know that a force must be applied to make an object accelerate or decelerate, and when translated into the language of fluid flow this implies pressure changes along the stream tube. The pressure changes obey Bernoulli’s equation, which tells us that when the speed \(V\) rises, the pressure \(p\) must fall and vice versa [1] [45]. In simplified form, the relationship between \(p\) and \(V\) appears thus:
(1)
\[\begin{equation} p \; + \frac{1}{2} \rho V^{2} \quad = \quad \text{constant} \end{equation}\]where \(\rho\) is the density of the air.
Figure 11
Figure 12
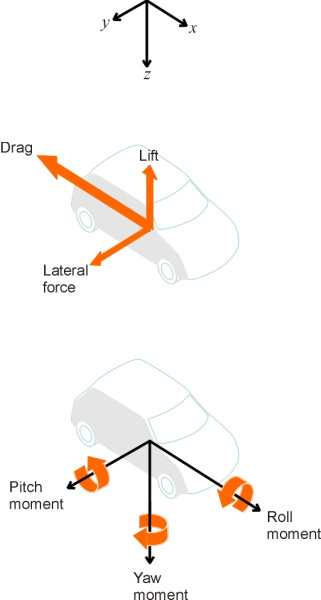
To summarise, we observe an array of shear and normal pressure forces acting on the vehicle body surface. Their overall effect can be pictured as having two main components: drag, which acts against the direction of motion, and lift, which acts upwards, at right-angles to the direction of motion. There may also be a net lateral force if the shape of the body is not symmetrical or if the air flow is not parallel to its longitudinal axis, and there are potentially three aerodynamic moments that tend to make the vehicle rotate (figure 13). The convention is to regard all the forces as acting at road surface level halfway between the front and rear axle on the vehicle centreline.
Figure 13
Lift
If you think of a car as a rounded hemisphere skating along the road surface like a beetle, it seems obvious that the air must rise like an arch over the roof and fall again in its wake. When the streamlines are squeezed together at the highest point of the arch, the pressure is appreciably reduced, and produces lift just like the wing of an aircraft although the motion of the air is messier and geometrically more complicated. To find the overall lift force we could in principle divide the body surface into small elements and work out the magnitude and direction of the normal force acting on each element, then sum the components that act at right-angles to the direction of motion.
In practice its value can be estimated from a simple formula because the lift \(L\) is proportional to the cross-sectional area \(A\) of the vehicle, the density \(\rho\) of the air, and the square of the vehicle speed \(V\) thus:
(2)
\[\begin{equation} L \quad = \quad \frac{1}{2} \rho V^{2} C_{L} A \end{equation}\]where \(C_{L}\) is a constant known as the lift coefficient. Typically, the value of \(C_{L}\) for a passenger car lies between 0.2 and 0.5 [47]. If we take the lift coefficient as 0.4 and the density \(\rho\) of air as 1.226 kg/m3 (this is strictly speaking the value at sea level [3]) then when cruising at motorway speed, say 120 km/h or 33.3 m/s, the lift force comes to
(3)
\[\begin{equation} 0.5 \times 1.226 \times 33.3^2 \times 0.4 \quad \times 2.0 = \quad 544 \; \text{newtons} \end{equation}\]which is equivalent to roughly 50 kg or a little under the weight of an adult passenger. Lift doesn’t actually slow the vehicle down, although it can affect the handling as we’ll see later. It increases rapidly with \(V\), and at higher speeds the load carried by the rear axle of a hatchback may fall by as much as 10% [25].
Drag
When a vehicle travels on a level road, the engine must produce enough power to overcome rolling resistance (see Section G0119) and aerodynamic drag. At low speeds, the drag is small, but it dominates at speeds over 80 km/h (50 mph). The drag is the component that acts against the direction of motion, so good aerodynamic design can make any car go faster, or save fuel, or achieve some combination of the two.
As mentioned earlier, drag forces on a car body have two distinct elements. First, there is friction with the boundary layer that acts like a shear force along the body surface. Again we imagine the body surface divided into small areas, each with a shear force acting on it. If we work out the shear force on each element, then add all the components of shear force aligned against the direction of motion, we obtain the total friction drag that acts on the vehicle to slow it down. The friction drag is roughly proportional to the total surface area, and the shape of the vehicle does not particularly matter.
The second element is the normal pressure that acts at right-angles to the body surface. If the body surface is divided in small areas, each with a force acting at right angles to it (figure 11), we see that some of the areas face towards the front, and some towards the rear, but most are inclined at some intermediate angle. The forces vary among them, each having a greater or lesser component in the direction of motion. The drag they impose is just the difference between the sum of the these forward-facing components and the sum of the rearward-facing components.
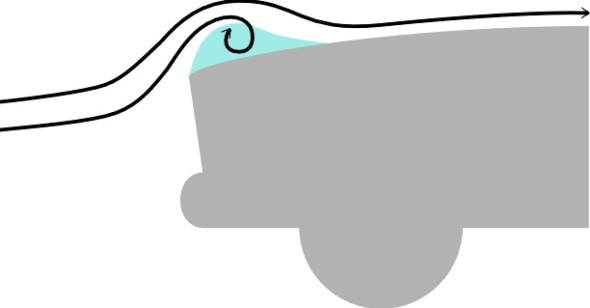
However, this normal pressure is more complicated than it first appears because it consists of two parts: pressure drag or form drag together with a component that we haven’t so far mentioned, the vortex-induced drag that is tied up with trailing vortices. Let’s deal with the pressure drag first. It arises because the boundary layer doesn’t always stick to the body over which it is flowing [8]. Towards the rear, as the air curves around the sides and begins to converge, it slows down and the pressure rises as one might expect. But it has lost energy through friction and may come to a halt before completing its journey. At this point the boundary layer reverses direction or separates, leaving a turbulent wake (figure 14). The pressure in the wake is less than it would have been had the boundary layer remained attached, and like a great suction pad, tends to slow the vehicle down. It turns out that the ‘base pressure’ within the wake is roughly uniform across the whole of its cross-section. Hence the pressure drag is roughly proportional to the cross-sectional area of vehicle at the point of separation of the wake. It accounts for a substantial part of the overall air resistance. The larger the cross-sectional area of the wake, the greater the drag. Conversely, if the boundary layer remains attached throughout, the pressure drag is theoretically zero.
This is why the fuselage of an aircraft, like many racing cars built during the early part of the 20th century, has a long pointed tail. The gradual taper discourages the boundary layer from breaking away until the last possible moment, and by reducing the cross-section of any wake, minimises drag. For an aircraft, there is little or no separation, so friction drag is important, while pressure drag is not. On a modern passenger car, the opposite is true. Pressure drag dominates because a long ‘aerodynamic’ tail is not practicable, and the largest single component of aerodynamic drag comes from the tubulent wake.
Figure 14
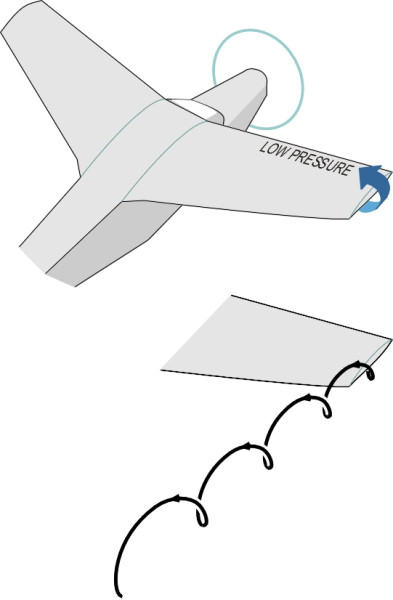
The second part, the vortex-induced drag, also arises from separation. A vortex resembles a swirling column or cylinder of air. The particles inside follow a helical path with the highest speeds occurring in the core. One type of vortex forms when the body deflects the air so that its direction of motion changes from upstream to downstream. Vortices of this type are known as trailing vortices because they extend rearwards into the atmosphere. A trailing vortex is produced for example by an aircraft wing because it deflects the air through a small angle to produce a downwash. Air ‘leaks’ around each wingtip from the underside to the upper surface, and the helical motion becomes a trailing vortex as shown in figure 15. We’ll be looking at some examples for road vehicles shortly.
Figure 15
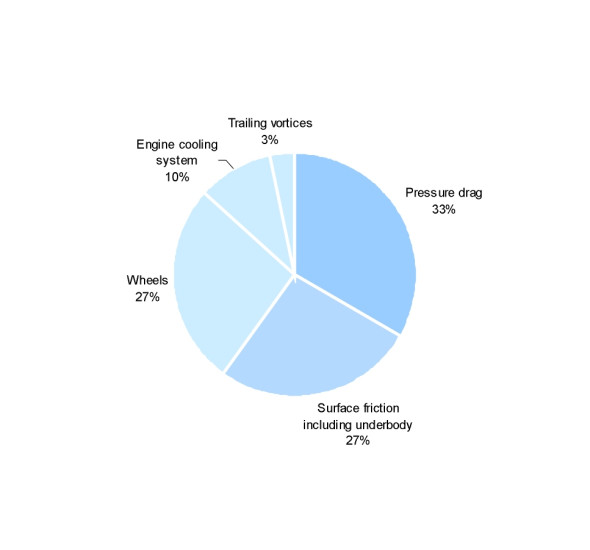
Another type of vortex known as a bound vortex arises at any corner on a vehicle body where the radius is too sharp for the boundary layer to remain attached, for example at the rear of a bluff vehicle body or in a separation ‘bubble‘ where the flow re-attaches to leave a swirling mass permanently bound to the body surface. Both types of vortex absorb energy and contribute to drag by altering the normal pressure at locations on the vehicle body near to the point at which the vortex is formed. On the whole, vortex drag is less important than the other types. As shown in figure 16, which is based on data tabulated some years ago by R H Barnard [6], pressure drag is usually the largest single component.
Figure 16
Like the lift force, although drag appears to be a complex amalgam of forces generated in different ways, the overall value acting on a moving vehicle can be estimated using a relatively simple formula. The formula enables one to make comparisons between bodies of different shapes and sizes. The overall drag force \(D\), measured in newtons, is given by:
(4)
\[\begin{equation} D \quad = \quad \frac{1}{2} \rho V^{2} C_{D} A \end{equation}\]where \(C_{D}\) is the drag coefficient, and as before, \(\rho\) is the density of air, \(V\) is the wind speed relative to the vehicle, and \(A\) is the cross-sectional area of the vehicle body. The drag coefficient expresses the effect of vehicle shape independently of any other factor, so that the \(C_{D}\) value for a car of a given shape remains the same if the car is doubled in size, for example. Neither does it vary significantly with speed over the normal range of variation characteristic of road vehicles [4]. A typical value for a passenger car is about 0.3, so when cruising at motorway speed, say 120 km/h or 33.3 m/s2, given an atmospheric density of 1.226 kg/m3, the drag force comes to
(5)
\[\begin{equation} 0.5 \times 1.226 \times 33.3^2 \times 0.3\quad \times 2.0 = \quad 408 \; \text{newtons} \end{equation}\]Because the drag is proportional to \(V^2\), a 10% increase in \(V\) will lead to a more than 20% increase in drag and hence an appreciable increase in emissions and fuel consumption.
Sources of drag for automobiles
Now let us look more closely at the individual parts of an automobile that produce drag. First, consider friction drag. The larger the surface area of the vehicle skin, the greater the drag. Skin friction acting on the upper body normally accounts for about 10% of the drag of a family car but it can be more for long vehicles such as buses or trucks [48]. It’s not just the smooth upper body panels that count. A lesser proportion comes from the wing mirrors and various other surface details such as door gaps and windscreen wipers. More important is the fact that almost half the surface area of a car lies within the wheel arches and underneath the body, all of which present rough cavities to the air stream. The confused flow pattern around the suspension, floor pan and sub-frames raises the friction drag to over a quarter of the total drag for a modern car [7] [37]. The wheels themselves are a major source of friction drag. Sports cars don’t necessarily perform any better than the mass-produced hatchback. In most cases, with the top folded down the air flow over the passenger compartment is turbulent, so the vehicle as a whole produces as much drag as a typical family saloon.
Now for the pressure drag and vortex-induced drag. Both arise from the shape of the vehicle body rather than its surface area as such. In the case of a family hatchback, the outline is disrupted by the angles of the bodywork. As a result, the flow pattern along the upper surface shows local separation in three areas, features that don’t occur with ‘pure’ aerodynamic shapes.
Figure 17
- First, separation can occur at the leading edge of the engine cover. This was common among cars designed during the 1970s, when a sharp leading edge for the engine cover was fashionable (figure 17); fortunately, the drag penalty was modest, because a boundary layer that separates near the leading edge usually re-attaches itself a little way downstream.
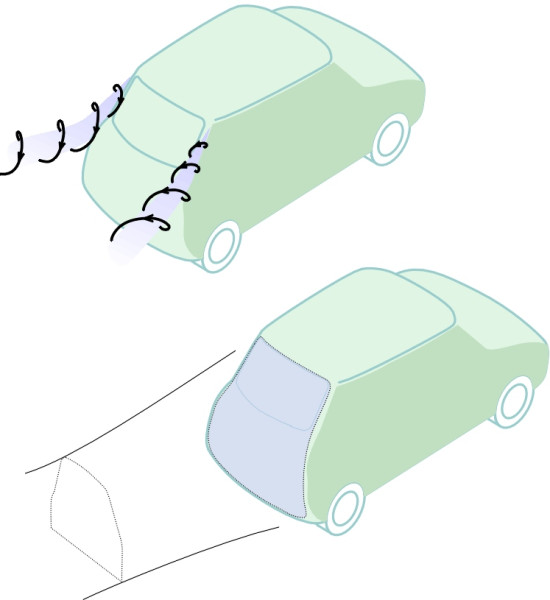
- A second location is the base of the windshield, then over the top of the windshield at the leading edge of the roof. Separation can also arise round both sides of the windshield to form trailing vortices that extend rearward into the wake from the A-pillars as shown in figure 18.
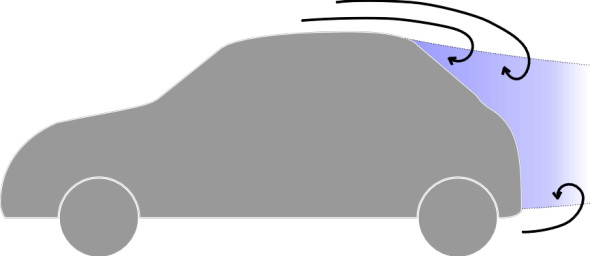
- Turning to the rear of the vehicle we observe the third and most dramatic feature for a modern saloon: the two trailing vortices formed on either side of the rear pillars together with a turbulent wake of across the whole rear of the car (figure 19). Inside the wake, the air pressure is lower than the pressure acting on the front of the car, and the resulting pressure difference is responsible for a major proportion of the overall drag.
Figure 18
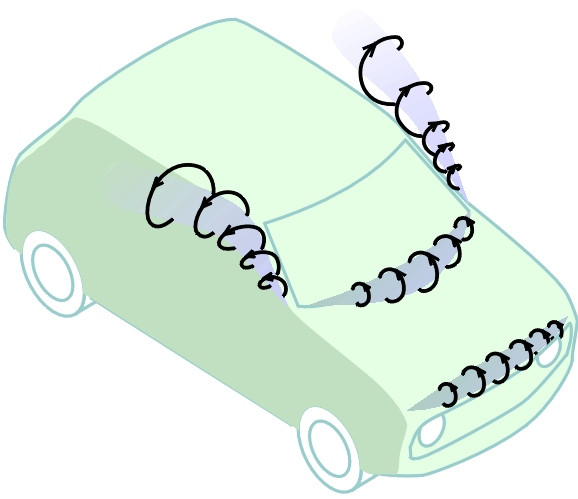
Figure 19
The ideal shape
So what is the potential for improvement? To find out, we first need to establish the theoretically ‘perfect’ shape. For the time being we’ll assume the wind is coming from straight ahead.
The zeppelin
For aircraft, the teardrop or zeppelin (figure 2) is the shape that encounters the least resistance when moving through the atmosphere at any speed below the speed of sound. The blunt nose and tapered tail, which encourage the air to cling to the sides without breaking off to form a turbulent wake, result in a drag coefficient of only about 0.04 [46].
You may be puzzled about the blunt nose. Common sense suggests that a pointed nose would pierce the air more easily and produce less drag. But in practice, it’s the shape at the rear that matters, because the shape at the rear determines how and where the boundary layer separates from the vehicle body and hence the cross-sectional area of the wake. The shape of the front is relatively unimportant. Here, the speed of the air in the boundary layer rises consistently as it moves around the nose and along the vehicle sides and roof, so the pressure is falling and with local exceptions the boundary layer has no difficulty holding on to the surface - in fact its contribution to pressure drag may be small and in some places negative. Therefore a blunt leading edge is as good as a sharp one, and moreover it has practical advantages because although not ideal, a rounded front is better suited than a pointed one to accommodate passengers or a bulky cargo. It is also lighter, less cumbersome to manoeuvre, and less prone to damage.
Can the zeppelin shape work for cars?
So can we apply zeppelin shape to build a really efficient automobile? The zeppelin has a low drag coefficient, but the long tail presents a problem and the cylindrical cross-section is not very convenient. And there is another complication. For minimum drag, a zeppelin must be flying well clear of the ground so the air can flow freely underneath as well as round the sides and over the top. In the case of an automobile, whatever its shape, the presence of the road surface profoundly changes the flow pattern. Imagine a miniature airship of roughly the same height and length as a family saloon, in other words, its length is equal to roughly three times its diameter, as shown in the upper part of figure 20. Because its shape is symmetrical, the pattern of streamlines must be symmetrical too, and if we imagine a horizontal plane slicing through the nose and tail (points O and P in figure 20), the proportion of air flowing over the top of the airship above this plane must be the same as the proportion flowing underneath. As the zeppelin descends towards the ground, the flow of air underneath is partly obstructed, and most of the streamlines curve upwards and arch over the top. Effectively it becomes a different shape having a larger drag coefficient [43].
Figure 20
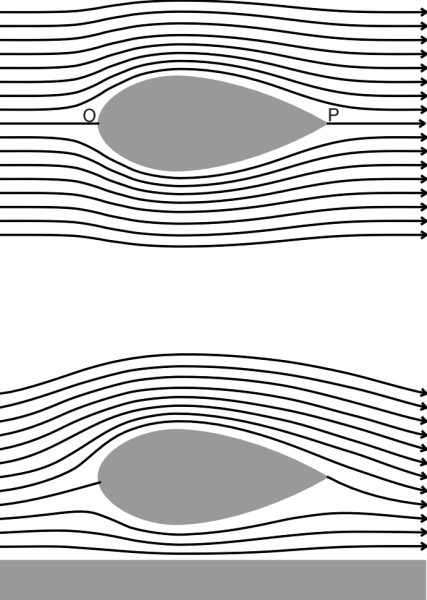
So why not cut it in half? Let us imagine a half-zeppelin skimming along the road with an infinitesimally small gap between the underside of the vehicle and the road surface (figure 21). Without altering the pattern of airflow or the drag coefficient we can in our imagination replace the semi-zeppelin with a whole zeppelin whose lower half takes on a virtual existence below the road surface together with its virtual streamlines. If the length-to-height ratio of the half-zeppelin is 3, the same as a family saloon, the whole zeppelin must have a corresponding ratio of 1.5. Effectively, the half-zeppelin moving close to the ground behaves like a whole zeppelin that is twice as fat in relation to its length, which inevitably increases the drag. Aerodynamic theory together with wind tunnel tests have confirmed that the drag coefficient for such a shape is in the region of 0.07 to 0.09 [44] [46].
Figure 21
However this doesn’t take into account the equipment such as wheels and suspension needed to make the vehicle roadworthy. The wheels raise the drag coefficient to about 0.15 [44]. Wing mirrors and the requirement for clearance within the wheel arches push it up to 0.3 [11]. This represents the target against which a modern production car should be measured.
The aerodynamically efficient automobile
The shape of an automobile is determined primarily by the need to carry people who are sitting upright between four wheels. It doesn’t fit naturally inside an idealised aerodynamic envelope such as the half-zeppelin. Fifty years ago, it was thought too difficult to design a family saloon that approaches the level of aerodynamic performance that is theoretically possible for an object of this size, and manufacturers gave a low priority to reducing air resistance.
But priorities have since changed. Perhaps as a result of growing concern about energy consumption and greenhouse gas emissions, manufacturers have revised the profile in subtle ways to reduce air resistance without compromising other requirements. The way to do it is not to make the car look like an aircraft. Although the same principles apply to both, in practice the drag comes from different sources and therefore cars and planes call for different types of aerodynamic treatment [2]. In the case of aircraft, there is almost no separation of the boundary layer so a high proportion of the drag comes from surface friction. In the case of an automobile it’s the other way round: the key is to eliminate or postpone separation and to minimise the cross-sectional area of the wake. Wind tunnel research has shown that the effects of quite small alterations, applied consistently to all parts of the vehicle body, can together produce a large drag reduction. Starting during the mid 1980s, a systematic approach along these lines resulted in several production models with a drag coefficient of about 0.3. One of the first to go into production was the 1982 Audi 100 [21]. The modifications can be broken down into three main areas: front end, rear end, and underbody plus engine compartment.
Rounding the front
If you turn back to figure 1 you’ll see that two of the streamlines terminate at the vehicle body, one at the front and one at the rear. The terminals, labelled S1 and S2, represent stagnation points where the speed of the air relative to the car body falls to zero. The position of the stagnation point S1 determines what proportion of the air flows underneath [13] [30]. Put crudely, less air underneath means less drag, so the first priority is to locate S1 together with the cooling inlet duct as low down as possible. Like a bloodhound, the nose should be close to the ground.
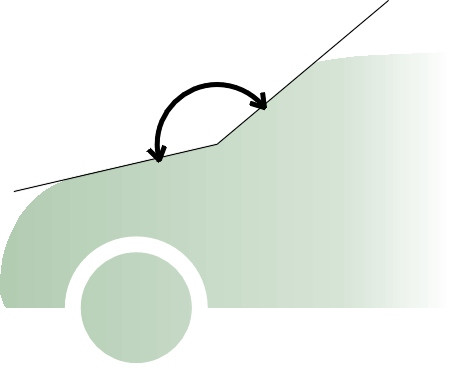
Air that doesn’t enter the duct must flow smoothly up and over the engine compartment, avoiding any abrupt change of direction that might cause separation (figure 17). The next problem area is the angle between the engine cover and windshield. The engine cover should slope steeply upwards from its leading edge, with the windshield raked astern so that the angle between them is as close as possible to 180 degrees (figure 22). In fact the windshield is associated with three distinct zones of separation: the trailing vortices from the A-pillars, the bound vortex (which remains in position rotating like a horizontal roller at the stagnation point at the foot of the windshield), and on some older cars, a line of separation at the leading edge of the roof. Rounding the A-pillars in horizontal cross-section reduces the intensity of the trailing vortices [15], although for a long, box-shaped vehicle, a comparatively small radius will do [35].
Figure 22
The rear
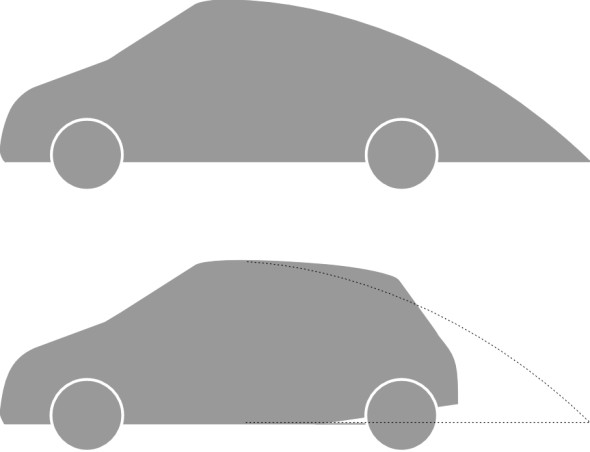
But the aerodynamic efficiency of a saloon car is not very sensitive to its shape at the front. If anything, what happens at the rear is more important. Ideally, the designer would shape the rear with an extended tail like that of the half-zeppelin, but if the tail were to enclose the passenger cabin and curve smoothly all the way down to floor level as shown in the upper part of figure 23, it would project an enormous distance behind the rear axle. Such a tail would also create lift together with trailing vortex drag [12]. Since the early 1930s, researchers have known that the tail of the zeppelin can be removed without incurring a large drag penalty provided there is no abrupt rise in air pressure in the boundary layer as the air flows over the roof and around the sides. If the pressure rise is gradual, energy from the neighbouring mass of air can be fed into the boundary layer via an exchange of fast-moving molecules at a rate sufficient to prevent separation. In recent hatchbacks, the cross section is reduced gradually downstream by tapering the roof, sides and under-body (figure 23). Then the body is truncated at the ‘natural’ point of separation. This ensures that the flow remains attached over a greater distance than would otherwise be possible, and reduces the area over which the ‘base of pressure’ in the vehicle wake acts. With a narrow wake and relatively modest negative pressure, the drag is reduced [8] [34] [38].
Figure 23
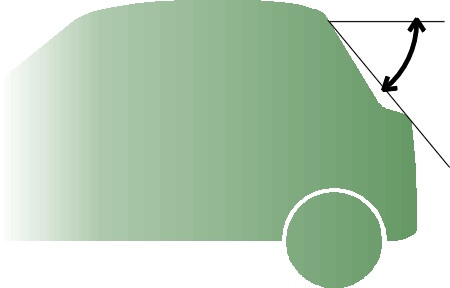
Over the years, designers have tailored different models of car to the needs of different types of customer. Among the alternative forms of rear-end treatment are the traditional ‘notchback’, the hatchback, and the fastback (figure 24). Surprisingly perhaps, the hatchback is among the least desirable of all possible shapes. The angle of the rear window or ‘backlight’ is critical, and it became a significant issue, for example, in the development of the Volkswagen Golf I [39]. Note that this angle is measured not along the slope of the glass itself, but as shown in figure 25, from the trailing edge of the roof to the trailing edge of the trunk (boot lid) [33]. The best results are achieved with a very shallow slope of 15\(^\circ\)to the horizontal (usually referred to as a ‘fastback’). The drag rises with increasing angle and peaks at around the typical hatchback angle of 30\(^\circ\) [36]. At this angle, the downwash keeps the air attached over the backlight but at the same time it encourages vortices from the rear corners and hence drag. As the angle increases further, the drag falls again, and in fact a squareback estate can have lower drag than a notchback based on the same body shape [14].
Figure 24
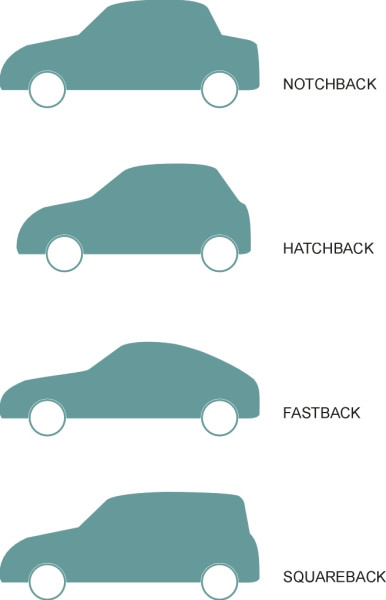
Figure 25
The under-body and engine compartment
While the sides and upper part of a car body are smooth, the underside is not. The irregular profile of the underbody has a significant effect on drag, and some manufacturers now provide plastic fairings under the engine bay, and also recess the exhaust pipe into the floor pan [16]. Equally important is what happens inside the engine compartment. The size and ducting of the inlet to the radiator together with flow inside the engine compartment has an appreciable effect on drag, contributing as much as 10-15% of the total [5]. There are several reasons for this: (a) air flow inside the engine compartment is turbulent which implies loss of energy, (b) some of the energy is dissipated in friction between the flow of cooling air and the comparatively large surface area of the engine and radiator, and (c) as it leaves the engine compartment, cooling air interferes with the external air flow to produce separation and turbulence [17] [41]. Indeed, if you blank off the radiator inlet the drag will fall and the car will actually go faster (until the engine overheats). It follows that the interior of the engine compartment represents a significant aerodynamic streamlining problem in the same way as the exterior. An important consideration is to restrict the air flow to the minimum necessary for cooling, which in turn implies a small inlet. The inlet duct for most models is now located at the front stagnation point low down beneath the registration plate where the air pressure is highest [28].
Stability
Lift has a destabilising effect on a road-going vehicle. Firstly, by reducing the contact force between the tyres and the ground, it reduces grip. Secondly, lift at the rear axle may have the effect of increasing the slip angle of the rear tyres relative to the slip angle of the front tyres, which can lead to oversteer and in extreme cases make the car dangerous to drive (see Section C0418). In fact, the designer really wants negative lift, and this is the reason why racing cars are fitted with inverted wings that press them down onto the road (see Section C1717). Drivers can use this downforce to tackle curves at higher speeds than they would otherwise do, which is how races are won or lost. The price for this downforce is extra drag, and in fact, Formula 1 cars are among the least ‘streamlined’ of all modern vehicles, with drag coefficients much larger than those of a typical family saloon.
Effects of wind yaw
So far, we have assumed that the stream of air that resists the car’s motion is coming from straight ahead. But unless the atmosphere at ground level is stationary, it will usually be aligned at an angle to the direction of motion (figure 26). This angle is often referred to as the wind yaw angle\(\; \psi\). In the UK, its ‘average’ value is said to be 5\(^\circ\) [23], and for most of the time, it is well within plus or minus 10\(^\circ\). But occasionally in a strong crosswind the angle can reach 20\(^\circ\). Any non-zero angle will usually produce an increase in both the drag and the lift, together with lateral forces and yawing couples that can interfere with directional stability. A sudden gust can blow a vehicle off-course, and occasionally even turn a goods vehicle onto its side [24].
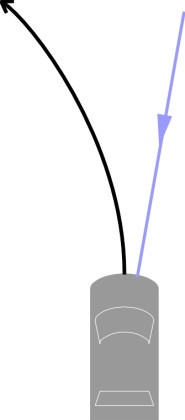
Here, we’ll concentrate on stability. Analysts usually divide the de-stabilising effect of a crosswind into two distinct components. Firstly, it creates a lateral force that can be pictured as acting at a single point - the centre of lateral pressure. This force will push the vehicle sideways across the road to a greater a lesser amount depending on the tyre slip angle. Secondly, unless the side force acts at the neutral steer point (see Section C0418), it will also make the vehicle rotate or yaw. There are differing views about the preferred direction of yaw. One might want the vehicle to turn into the wind like a weathercock so that it steers itself automatically, as it were, back towards its original path. Unfortunately, for most saloon cars the side force acts at a point well forward of the neutral steer point, about one third of the car’s length from the front [18]. Hence the car will rotate or yaw away from the direction of the wind (figure 27), thereby accentuating the crabwise deviation. The yaw moment is therefore considered by designers as potentially more dangerous than the side force itself [19] [27]. Moreover, many cars have a built-in front wheel castor such that any lateral force at the centre of the contact patch tends to swivel the front wheels about the kingpin axis in a manner that exacerbates the effect.
Figure 26
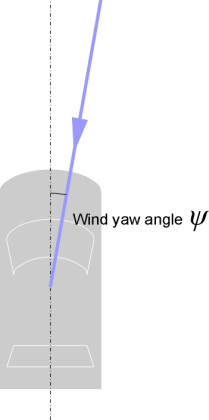
Figure 27
So what can the designer do to ensure that the car is stable? There seems to be broad agreement that the lateral centre of pressure should be aft of the centre of mass or at least close to it (see, for example [20] [26], and also the extensive discussion in [32]). This is only possible with a ‘squareback’ or estate car design. A high rear end helps, although if the basic dimensions have already been fixed it may be quite difficult to make the vehicle stable through minor changes in the body shape; occasionally in the past, it was not unknown for a designer to add a fin to a sports racing car as a last resort. A rounded shape introduces special difficulties, because the point at which the airflow separates (around the rearmost roof pillar) can move, leading to a sudden increase in yaw moment as the intensity of the crosswind increases. In the case of the Ford Sierra, the problem was cured by added a raised plastic strip to the roof pillar, which provided a trigger and thereby anchored the separation to a fixed point on the body surface [20].
Conclusion
Consciously or not, we tend to choose cars that reflect our personalities. Those of us who find speed exciting will want a powerful engine, and perhaps fit aerodynamic ‘add-ons’ such as a front dam, rear wing, spoiler, or side skirts, with the intention of reducing drag and making the car go faster. Unfortunately, the aerodynamic add-ons may not actually help. Most cars today are aerodynamically efficient and there is little scope for improving the standard configuration [42]. A rear spoiler may increase downforce and stabilise vortices to reduce buffeting, but rather than reducing drag, it usually adds to it [9] [22] [29] [31] [40]. One might do just as well to buy a basic ‘entry level’ model: with narrow tyres and the smaller radiator that goes with a small engine, the cheapest variant may not be very quick, but it will have cleaner aerodynamics and a lower drag coefficient. And with better aerodynamic stability as well as less drag, the estate car version will may be better still.
Acknowledgements
Figure 3: Image Public Domain, available at http://commons.wikimedia.org/wiki/File:Jamais_contente.jpg#mediaviewer/File:Jamais_contente.jpg, accessed 01 August 2021.
Figure 7: Porsche 356, author Luc 106, public domain, available at http://commons.wikimedia.org/wiki/File:Porsche_356_Pre-A_1948.JPG, accessed 09 March 2015.
Revised 09 March 2015