G.1619
Hysteresis losses in rolling wheels
For some years, railway engineers and road vehicle engineers have been trying to unravel the causes of rolling resistance (see Section G0119) and where possible, find ways of reducing it. What interests them most is the contact patch, where three things happen. First, the wheel tyre or tread is squeezed repeatedly against the track surface. Second, the track surface is likewise squeezed by the tread. Thirdly, the two surfaces ‘scrub’ across one another. All these processes dissipate energy and therefore slow the vehicle down.
The loading cycle
Let’s imagine that the wheel is attached to a wooden cart. The cart could be running on steel rails like a horse-drawn tram, or it could have pneumatic tyres; the same principles would apply in either case, but this particular cart has wooden wheels with steel rims and it is running on a smooth gravel track. It is being pulled by a horse, and the horse is wondering why it must pull so hard even though the track is smooth and level. Where is the friction coming from?
Figure 1
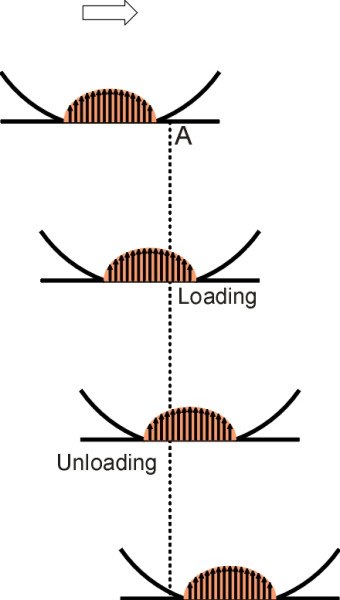
We’ll start by looking at what happens to the track as a wheel passes over. Let us assume to begin with that the contact patch is symmetrical in the fore-and-aft direction with a total length \(2a\), and located vertically underneath the axle centreline. Now focus on a particular point A on the track surface ahead of the wheel. Until the leading edge of the contact patch arrives, all stresses at the track surface are zero. As the wheel passes over, two things happen in sequence. First, the track experiences a build-up of vertical compressive stress until it reaches a maximum value roughly when the centreline of the axle is directly overhead (there are other stresses as well but they’re less important). Second, the stress declines as the rear section of the contact patch passes over, falling to zero at the trailing edge. Together, these two events form a ‘loading cycle’ in which a load is firstly applied and then removed (figure 1). Now consider what happens to a small area of the tread during one revolution of the wheel. For most of this period, the area concerned is rotating clear of the track and free of load. Only when it comes into contact with the track does the compressive stress begin to rise. It then follows a loading cycle similar to the loading cycle applied to the track – a mirror image if you like.
Figure 2
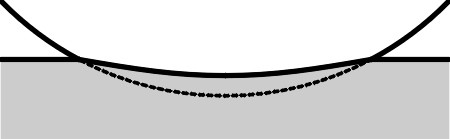
If we look more closely during the first part of the cycle, we see that the shape of the tread and the shape of the track surface both become distorted. The wheel applies forces to the track surface, which deflects a little, mostly downwards. In turn, the track reacts upwards on the wheel (if it didn’t, the wagon would fall through). Under pressure, the radius of the wheel, which we’ll denote by \(r\), is slightly reduced (figure 2).
When a force pushes at something, and the thing moves or gives way (even if only a little), we say that ‘work is done on’ the object concerned. Energy is expended equal to the force times distance moved. Here, the wheel is deflecting the track, so the track is receiving energy from the wagon. Simultaneously, the upward pressure of the track squeezes the wheel and hence the wheel itself is having work done on it. In the case of a pneumatic tyre, the deformation is obvious, but in the case of a steel-rimmed wagon wheel it is too small to be seen with the naked eye. Nevertheless the wheel is absorbing energy which, together with the energy pumped into the track surface, must come from somewhere.
Now for the second part of the loading cycle. Ideally, both wheel tread and track would be made of perfectly elastic materials. Not only would they recover their original shape after contact, but all the energy put into the wheel and track by the vehicle would be returned. The energy flow into the track would be reversed as the track surface rose behind the axle centreline, pushing the wheel forward. Simultaneously, the wheel tread would expand in the rear half of the contact patch and again help to push the vehicle forward. Gains in the second part of the cycle would exactly balance losses in the first part, so that no energy would be dissipated from the vehicle. There would be no resistance to motion.
Hysteresis
This is not what actually happens. The loading phase and the recovery phase are not symmetrical, and during each cycle some of the energy put into the wheel and track is irretrievably lost. The process is said to exhibit hysteresis. Assuming that the contact surfaces are perfectly smooth, in metals the hysteresis losses are small. This is because metals are crystalline; each atomic nucleus is locked into a regular lattice, and although the lattice will distort a little under pressure, each nucleus stays in position. The movement is taken up by squeezing and stretching of the electrical bonds between neighbouring atoms; when the pressure is removed, they spring back into their original positions as if nothing had happened. Energy losses take place only at the crystal boundaries and they are relatively small.
Polymers, by contrast, consist of complex molecules built up into chains. They do not form a regular lattice, but rather a tangled mass. In particular, rubber molecules wind around both themselves and their neighbours, and when stress is applied to the material, the molecules unwind, dragging their side-chains across one another. This results in friction, which is ultimately dissipated as heat.
So any wheel will absorb and dissipate energy when rolling: not very much in the case of a steel wheel, rather more for rubber tyre. But what about the track? It turns out that some of the energy put into the track is radiated into the ground below in the form of vibrational waves that carry energy away with them like sea waves that are stirred up during a storm. There are other losses too, including the kinetic energy carried away by grit that is sent flying when crushed by the wheel, the plastic flow of tiny ‘asperities’ on the surface of a metal tread or metal rail, and the grinding between the wheel and track as their respective surfaces adjust to one another when distorted. Eventually, through one mechanism or another, the energy is converted into heat.
Figure 3
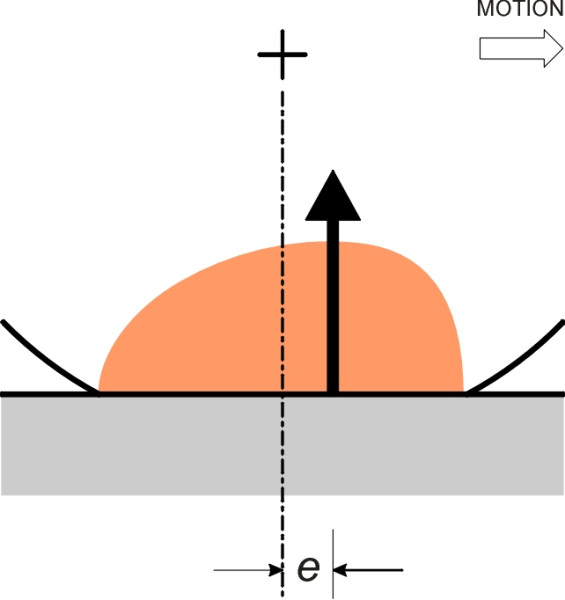
Figure 4
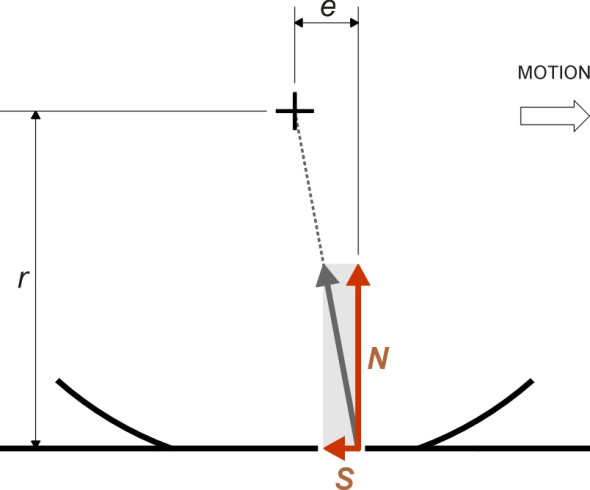
To sum up, then, energy flows out of the wheel and into the environment as heat. When you ride on a bus or train, you wouldn’t normally be aware of this: it’s not intuitively obvious how energy can flow out of a wheel. It’s certainly not obvious to the horse we referred to earlier. When pulling a cart, what the horse experiences is more direct: a ‘drag’ or horizontal force that resists motion. But a logical chain of reasoning connects these two pictures, (a) the energy lost through the wheels, and (b) the resistance felt by the horse. The energy losses mean that in the rear part of the contact patch, which corresponds to the unloading part of the loading cycle, the pressure between the wheel rim and track is reduced because the wheel and track surface do not spring back with the same vigour as they would were they perfectly elastic. The pressure distribution is no longer symmetrical fore-and-aft, and the centre of pressure moves forward (figure 3). Suppose it moves forward by a distance \(e\). Given a frictionless bearing, if the wheel is rolling at a steady speed the resultant force must still pass through the axle centreline. It follows that there must be a horizontal shear force \(S\) acting on the wheel through the contact patch (figure 4), and by similar triangles, the ratio of \(S\) to the normal contact force is \(e/r\). Hence
(1)
\[\begin{equation} S\quad = \quad \frac{e}{r}N \end{equation}\]This is the resistance that the horse actually feels.
Predicting the rolling resistance
The geometrical deformations within and around the contact patch may be complicated: for example, in the case of a car tyre, the walls bulge outwards while the tread flattens within the contact patch and bulges at the rear. To predict the heat losses, tyre specialists must resort to computer modelling. Similarly, the shape of a railway wheel and the way it engages with the surface of the rail is geometrically complicated. But if we know the size of the contact patch, we can make a rough estimate from first principles.
In fact the size of the contact patch tells us something straight away because it determines the limits within which the centre of pressure must lie. From figure 4, we see that a small contact patch implies a small wheel rolling resistance \(S\), and if we have reason to believe that the contact patch is symmetrically located under the axle centreline, then the centre of pressure must lie within a distance \(\pm a\) of that centreline. This places an upper limit on \(e\) and correspondingly an upper limit on \(S\).
Railway wheels
We can analyse a railway wheel using a method that applies specifically to materials in which the hysteresis losses are small. Suppose the width of the contact patch is \(2b\). When a cylinder of length \(2b\) rests on a flat plane, the contact patch consists of a thin strip or rectangle (figure 5). The normal contact pressure between the two surfaces is not uniform across this rectangle. According to principles first laid down by Heinrich Hertz in 1882 for perfectly elastic materials, the value at a point \(x\) measured from the centre of the contact area in the direction at right angles to the axis of the cylinder is given [8] by:
(2)
\[\begin{equation} p(x) \quad = \quad p_{0} \sqrt{1 \; - \; \frac{x^2}{a^2} } \end{equation}\]We assume that a stationary railway wheel generates a pressure distribution similar to that of the cylinder, and that the materials are perfectly elastic so the shape of the curve doesn’t change when the wheel starts to move. Denote the tread radius by \(r\) and let the wheel load be \(P\). As shown in figure 6, the pressure rises from zero at the leading edge of the contact patch to a maximum in the centre, and falls to zero at the trailing edge. The curve is elliptical in shape, and the peak value \(p_0\) is given by
(3)
\[\begin{equation} p_0 \quad = \quad \frac{P}{\pi ab} \end{equation}\]If the wheel and rail were perfectly elastic, there would be no energy lost in rolling contact, the pressure distribution would be symmetrical about the axle centreline, and there would be no rolling resistance. On the other hand, if a proportion \(\alpha\) of the energy put into the wheel and track during the loading phase were not recovered owing to hysteresis, then the pressure distributions in the two halves would differ and the rolling resistance could be appreciable. Is there a simple way of predicting its value?
Figure 5
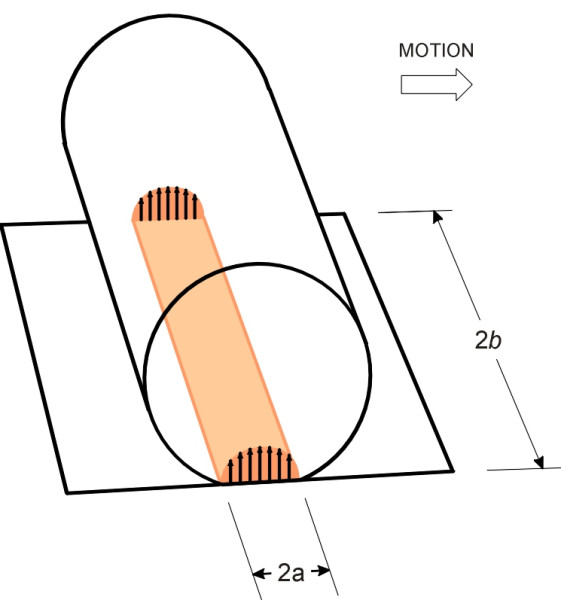
Figure 6
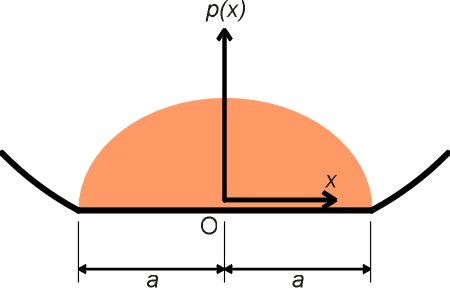
Figure 7
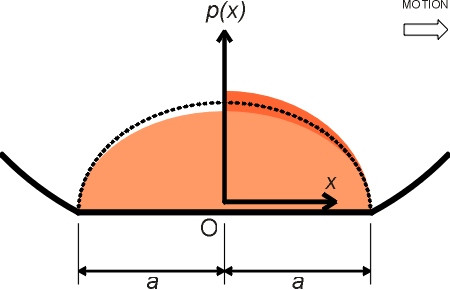
Professor John Williams has suggested an ingenious method that relies on the value of \(\alpha\) being small [9], which is indeed the case for a railway wagon with steel wheels running on a steel rail. Although he does not claim that the method is accurate, the answer it gives in this case is illuminating. The pressure distribution in the trailing half of the contact patch is assumed to be a mirror image of the pressure distribution in the leading half except that its value is everywhere reduced by the factor \(1 -\alpha\) (figure 7). Denote by \(P_L\) and \(P_T\) the loads carried by the leading and trailing halves of the contact patch respectively. Then
(4)
\[\begin{equation} P_T \quad = \quad \left( 1 - \alpha \right)P_L \end{equation}\](5)
\[\begin{equation} P_L \; + \; P_T \quad = \quad P \end{equation}\]From which we see that
(6)
\[\begin{equation} P_L \quad = \quad \frac{1}{(2 - \alpha)} \, . \, P \end{equation}\](7)
\[\begin{equation} P_T \quad = \quad \frac{(1 - \alpha)}{(2 - \alpha)} \, . \, P \end{equation}\](8)
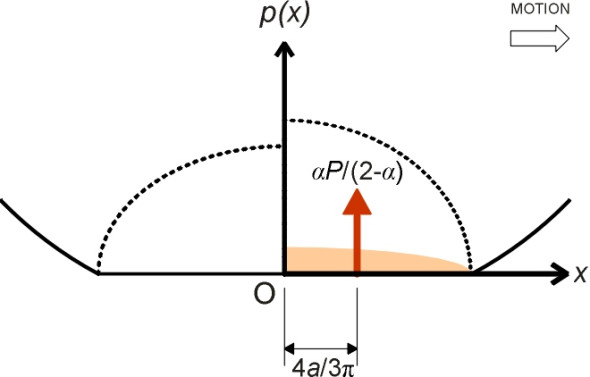
\[\begin{equation} P_L \; - \; P_T \quad = \quad \frac{\alpha}{(2 - \alpha)} \, . \, P \end{equation}\]Now imagine flipping over the curve representing the pressure distribution in the trailing half and superimposing it on the curve for the leading half. The difference between the two represents the effect of hysteresis, which from equation 8 imposes a component \(\alpha P / (2-\alpha)\) of normal contact force that is offset from the axle centreline, at the centroid of the half-ellipse bounded by the dashed line shown in figure 7. It is a well-known geometrical property of the half-ellipse that this centroid is located at a distance \(e \; = \; 4a / 3\pi\) from the origin as shown in figure 8.
Figure 8
From now on, we shall ignore the symmetrical components of the normal contact force, which cancel one another out and therefore do not contribute to rolling resistance. What remains is the hysteresis component. Now for any freely rolling wheel, the resultant of the ‘hysteresis’ normal contact force and the frictional resistance force must pass through the wheel centreline as shown previously in figure 4. Substituting \(4a / 3 \pi\) for \(e\) and \(\alpha P / (2-\alpha)\) for \(N\) in equation 1, we get
(9)
\[\begin{equation} S \quad = \quad \frac{2a}{3 \pi r} . \frac{\alpha P}{\left( 1 - \frac{\alpha}{2} \right)} \end{equation}\]By analogy with a conventional friction coefficient, we can define the ‘wheel rolling resistance coefficient’ \(\mu_S\) by the ratio \(S/P\). From equation 9, we see immediately that
(10)
\[\begin{equation} \mu _S \quad = \quad \frac{2a}{3 \pi r} . \frac{\alpha}{\left( 1 - \frac{\alpha}{2} \right)} \end{equation}\]Let us put in some typical values, assuming \(\alpha\) is 1% or 0.01. For a railway wheel of radius 500 mm whose contact patch is 10 mm long in the fore-and-aft direction, equation 10 predicts the value of the coefficient of wheel rolling resistance as (2 \(\times\) 5 \(\times\) 0.01) / (3 \(\times\) 3.14 \(\times\) 500 \(\times\) 0.995) = 0.000021. This is extremely small, much smaller than the figures quoted by railway engineers, which are usually in the range 0.001 to 0.002 (see for example [3]).
Clearly we have left something out. Our simplified analysis ignores energy losses associated with ‘micro-slip’ within the contact patch. One particular form of micro-slip occurs because the surface of the wheel tread and the surface of the rail are distorted when they come into contact. As shown in figure 2, the length of wheel rim measured around its circumference is slightly more than the length of the contact patch into which it is compressed. Likewise, the length of rail surface increases slightly as it is dented by the wheel. Hence there must be some slippage and grinding as the wheel rolls along the track. There are other types of grinding too. As detailed in Section G0119, the most important ones arise from a worn wheel tread or rail profile together with intermittent collisions of the wheel flange with the edge of the rail. Together, these two processes tend to swamp the ‘pure’ rolling resistance represented in our model, and explain why there isn’t a reliable formula for predicting the wheel rolling resistance of railway vehicles. Instead, engineers resort to empirical data or to computer simulation modelling in which the condition of the wheels and track are explicitly taken into account.
Car tyres
Can we analyse car tyres in the same way? Unfortunately not, because Williams’ method assumes a sudden fall or discontinuity in the pressure distribution at the centre of the contact patch (see figure 7). In reality, the fall in pressure must take place smoothly over an appreciable distance. This might be ignored if \(\alpha\) were small, i.e., the pressure drop were just a few percent. With car tyres, however, the hysteresis losses are much larger, because 50% or more of the energy put into the tyre is dissipated as heat.
Nevertheless, we’ll do the calculations and see what happens. For a stationary tyre, the internal pressure is constant across the whole of the inside of the tyre wall and tread. Hence the contact pressure distribution is no longer elliptical in shape. We shall not give the details here, but if one assumes a uniform profile so that the offset load component now acts at a distance \(e \; = \; a/2\) ahead of the axle centreline, for a tyre of radius 312 mm with a contact patch roughly 120 mm square, the coefficient of wheel rolling resistance turns out to be around 0.03. This is not very accurate but it is the right order of magnitude: the value quoted for ordinary car tyres is usually in the range 0.01 to 0.02 [6].
It seems that car tyres induce a larger rolling resistance than railway wheels. The picture is complicated by the fact that on a real road, the tyre tread is squeezed against stone chippings embedded in the road surface that measure around 10 mm across [1]. The tread rubber deforms over each ‘asperity’, and some of the energy absorbed in the deformation process is dissipated as heat. So how can the losses be reduced? Nearly thirty years ago, a research conference was convened in the USA to review the state of the art. It was known at the time that as a result of changes in tyre chemistry, the rolling resistance of car tyres had been falling steadily for some years, but there was potential for further improvement. It has since been confirmed that the avoidable losses can be reduced broadly in three ways.
- One can use different varieties of rubber for different parts of the tyre. To preserve grip, we want high-hysteresis rubber in the tread, while to reduce rolling resistance we want low-hysteresis rubber in the tyre walls.
- Alternatively we can use the same material throughout, but tailor the chemistry so that it behaves differently under different loading conditions [5]. When considered as a whole, the tyre structure is subjected to a certain frequency of loading – each part of the carcass is deformed once per revolution as it passes through the most heavily loaded region, the area in and around the contact patch. The frequency of this load/unload cycle is typically about 10 Hz depending on vehicle speed [7]. If we now examine more closely what happens within the contact patch under heavy braking, we see additional deformation of the tread as it creeps over individual stone chips as previously mentioned. If the tread creeps at 1 m/s, the load/unload cycle at this local scale has a frequency of the order of 100 Hz. Therefore we want a tyre material with low hysteresis losses at 10 Hz and high hysteresis losses at 100 Hz and above. Some manufacturers hope to achieve this by substituting silicon for carbon black in the rubber composition [10].
- The third way is to change the size and shape of the tyre structure, with a larger diameter [2] and a narrower profile. The principle underlying the narrow ‘eco-tyre’ has been known for quite a long time [4]: energy is lost every time a road surface asperity makes a depression in the tread surface. A long, narrow contact patch will encounter fewer asperities per unit distance travelled than a short, wide one of the same total area (figure 9), and hence will generate proportionately less rolling resistance.
Figure 9
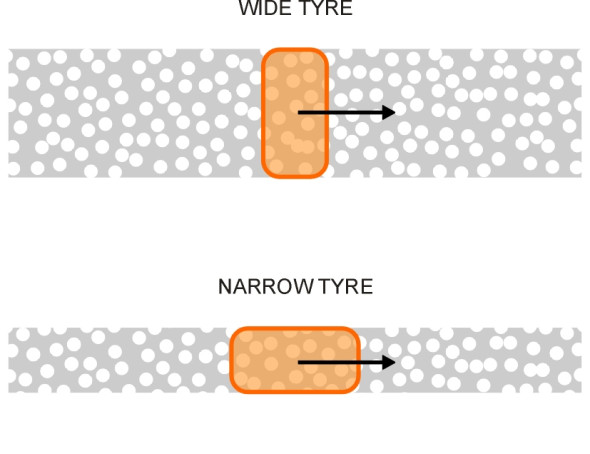
On this last point, we can be a little more precise. Suppose the contact patch of the first tyre has width \(2b\). When it rolls a distance \(x\), say, the total area of tyre tread that is squeezed against the road surface is \(2bx\). Given a uniform density of asperities per unit area of road, the energy loss is proportional to the area that is compressed, in other words, it is proportional to \(2bx\). Now consider a second tyre whose contact patch is half the width of the first, but twice the length so that the total contact area and the average contact pressure are unchanged. The area of fresh tyre coming into contact with the road for every metre of travel is now half its previous value, at just \(bx\), and therefore the tread hysteresis loss is halved too.
But what about grip? It turns out that grip is not affected, because it arises from relative motion between the tread and the track surface. In the case of braking for example, as already described, asperities ‘plough’ through the tread material and develop contact forces that are parallel to the plane of the contact patch as opposed to normal contact forces. At any given moment, the number of asperities that generate braking resistance is proportional the area of the contact patch and is therefore unchanged. Hence there is no loss of grip. While narrow tyres are not considered fashionable today, eventually they may supersede low-profile tyres because they save fuel, and as a welcome by-product, they will make less noise.
A loose end
It seems that you can reduce the rolling resistance of a rubber tyre by making it narrower, provided the contact area remains unchanged. It reduces the air resistance too. So why don’t all cars have narrow tyres?
Revised 11 February 2015