© Penny Wright
G.0216
Passengers in motion
People travel for many reasons: to get to work, for example, or to visit friends. Some enjoy the journey, but most just want to get to their destination quickly and at minimum cost. People also appreciate a comfortable ride because, apart from anything else, a comfortable ride is reassuring. Unless you are driving your own car, you’ll be trapped in a vehicle under someone else’s control, and a rough or jerky ride gives the impression that the driver is not too concerned with the passengers’ welfare. In this Section we’ll try to assess the motions and forces that passengers undergo together with the limits that are considered acceptable in vehicle design. Surprisingly, it turns out that in one area at least, there is scope for improvement.
Aspects of motion
Like most mammal species, we are born with arms and legs together with the nerves and muscles needed to move them, a visual system, and the ability to judge distances and times on a human scale. In other words, we have evolved for moving about on foot. Until only a few hundred years ago, travel on foot was the only option and no-one moved faster than 5 metres per second for very long. Eventually, for those who could afford to keep one, the horse opened up new possibilities. But even at the beginning of the 20th century, most city dwellers walked to work. Things changed with the arrival of the steam engine, the electric tram, and the motor car, all of which subjected us to speeds and forces we had not experienced before.
Types of motion
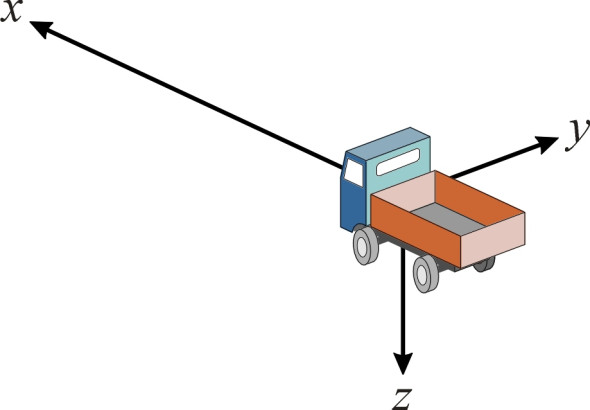
You might imagine that when you travel from A to B you are moving in one dimension only: forward. But in principle there are six ‘degrees of freedom’ that describe the possible movements of a person or a vehicle in three-dimensional space. Three of them involve a change of location: backwards and forwards, from side-to-side, and up-and-down. The motions are usually specified in terms of a coordinate system attached to the moving vehicle (figure 1), and here we shall align the \(x\) axis with longitudinal motion (positive forwards), the \(y\) axis with sideways motion (positive to the right), and the \(z\) axis with vertical motion (positive downwards). A car journey involves continuous changes in all three, preferably with large changes in \(x\) accompanied by small changes in \(y\) and \(z\). The remaining degrees of freedom involve rotation around the \(x\), \(y\) and \(z\) axes. Unless you are travelling in a spaceship, rotating motions are unlikely to cause discomfort, so for the purposes of this Section we will ignore them.
Figure 1
Forward speed \(v\) is defined as the rate of change of \(x\) with time, so
(1)
\[\begin{equation} v \quad = \quad \frac{{dx}}{{dt}} \end{equation}\]Many people find speed stimulating, some terrifying, but straight line motion at constant speed has no effect on the human body. From the moment of birth we are all carried around with the earth’s surface at speeds of anything up to 1700 km/h relative to the poles, and no-one notices. Imagine a helicopter travelling in a particular direction at speed \(v\). Provided the speed is constant and the helicopter follows a straight line, without looking out of the window the passengers will have no idea of the direction in which they are travelling, or indeed whether they are making any progress at all.
Acceleration
What we notice is change of motion. Change of motion is measured in terms of acceleration, which we’ll denote by \(a\). Acceleration is defined as the rate of change of speed so that
(2)
\[\begin{eqnarray} a \quad & = & \quad \frac{dv}{dt} \nonumber\\ \nonumber\\ & = &\quad \frac{{d^2}x}{d{t^2}} \end{eqnarray}\]Newton’s first law of motion links acceleration and force. If you slow down or speed up there must be a force acting on your body. You’ll be pressed back into your seat in a sports car as it accelerates away from a traffic signal. Actually, you’re being pressed forward, because the seat is accelerating into the space that your body was previously occupying, pushing you from behind. Similarly, when an elevator picks up speed from the ground floor, it presses on the soles of your feet so that you feel heavier than you normally would. Newton’s second law quantifies the link. It tells us that
(3)
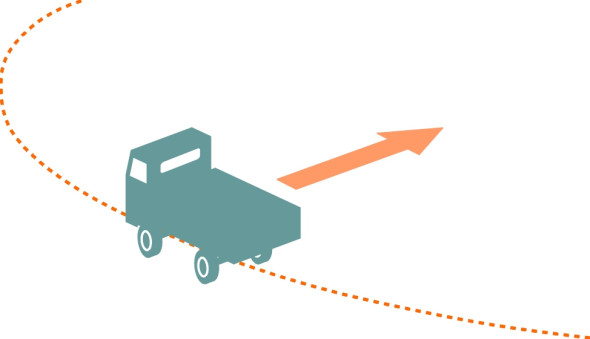
\[\begin{equation} \text{Force} \quad = \quad \text{mass} \; \times \; \text{acceleration} \end{equation}\]Forces are needed to make things travel along a curved path too. If you go round a curve in a car you’ll experience the sensation of being flung sideways out of your seat. Actually, it is the other way round. The tyres are diverting the car away from a straight line, and in turn the car is diverting you. You are being accelerated laterally towards the centre of the curve (figure 2), continually picking up speed at right angles to the direction in which the car is pointing. This acceleration will continue for as long as the vehicle maintains a curved path. The force is given a special name, centripetal force, but it is really no different from any other force that speeds you up or slows you down. It happens to be in the \(y\) direction rather than \(x\) or \(z\).
Figure 2
So in a vehicle, you can experience forces in any of three directions: fore-and-aft when the vehicle brakes or accelerates, vertically when the vehicle rides over a hump-backed bridge, say, and laterally on corners. For railway passengers the vertical forces are quite small. If you are driving a tractor on a bumpy road, they are not. Lateral forces and longitudinal forces are particularly important when you are standing on a bus, because they can make you stagger and fall. However, a steady force is quite manageable once you get used to it. If you stand on a particular spot on a merry-go-round, you will naturally lean towards the centre. Once acclimatised, you won’t need to adjust your posture as long as the merry-go-round continues to revolve at the same rate.
Jerk
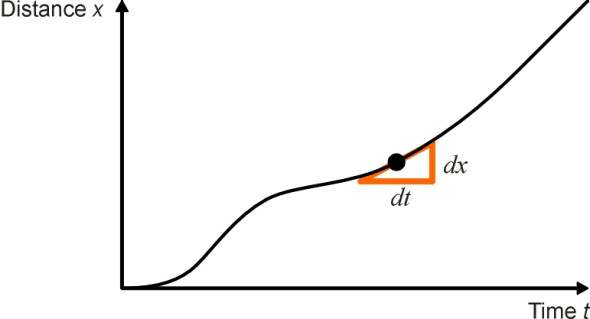
We have seen that speed is calculated as the rate of change of position. Therefore if we plot the distance travelled as a function of time, the speed of the vehicle at any given point is equal to the slope of the curve at that point (figure 3). In other words, to find the speed, we differentiate the distance travelled with respect to time. We’ve also seen that we differentiate speed to get acceleration. But what happens if we differentiate acceleration? The answer is that we get jerk, thus:
(4)
\[\begin{eqnarray} \text{Jerk} \quad & = & \quad \text{rate of change of acceleration} \nonumber\\ \nonumber\\ & = & \quad \frac{{da}}{{dt}} \nonumber\\ \nonumber\\ & = & \quad \frac{{{d^2}v}}{{d{t^2}}} \nonumber\\ \nonumber\\ & = & \quad \frac{{{d^3}x}}{{d{t^3}}} \end{eqnarray}\]A passenger can adjust to constant acceleration because the forces associated with constant acceleration remain steady over time. But changing acceleration (non-zero jerk) implies a changing pattern of forces for which it is hard to compensate, and some kind of physical support is needed. If you are lucky enough to have seat on a bus, you will be restrained by the seat and backrest, but if you are standing and you let go of your handhold while, for example, making your way towards the exit door, you are at risk of tumbling over. The same applies to passengers on trains, with the added complication that railway passengers are accustomed to walking about freely inside the vehicle while it is moving. Table 1 contrasts the values of jerk and acceleration that seated and standing passengers might be expected to tolerate. In practice, many railway operators aim to restrict lateral acceleration to smaller values than those shown in the table: less than 1.0 m/s2 on urban services and 0.5 m/s2 on inter-city services [6] [23].
Figure 3
| \(\) | Acceleration (m/s2) | Jerk(m/s3) |
| Free standing | 0.6 | 1 |
| Standing with handhold | 2.0 | 3 |
| Seated | 3.5 | \(<\) 2.45 |
Some specialists quantify these limits in a different way. Let’s denote the maximum recommended acceleration level by \(a_{max}\) m/s2. Assume that during some particular manoeuvre the acceleration rises from zero to \(a_{max}\) at a constant rate, so the jerk level \(j\) for passengers is constant throughout. Then the minimum time needed to reach peak acceleration is \(a_{max}/j\) seconds. This period is called the rise time. The lower the jerk level, the longer the rise time. From the acceleration and jerk values listed in the table we can easily work out the rise times needed by passengers to adjust to the maximum recommended acceleration levels. They range between 0.5 and 1.5 seconds.
Vibration
The up-and-down motions we experience as vehicle passengers vary continually throughout a journey. So do the movements from side-to-side. Each can be decomposed into sine waves of varying frequency, in other words, a set of vibrations. As humans we respond to vibration in different ways depending on the frequency. Up to now, we have been dealing with accelerations having a rise time of at least a second or two, long enough for the passenger to be aware of the direction in which he or she is being propelled. These movements correspond to frequencies of less than 1.5 Hz. At these low frequencies, we try to adjust to the motion and compensate for it by muscle action. For example, when standing on an underground train we lean in the same direction as the acceleration of the carriage floor, and as the direction changes, for example when the train slows down on the approach to a station, we adjust accordingly.
When the vibrations oscillate more quickly, that is, the frequencies lie between 1.5 Hz and 10 Hz, we don’t have time to compensate and indeed may not be able to distinguish the direction (\(x\), \(y\) or \(z\)) in which the movements are taking place. Instead, we tense our muscles to restrain vibration of the inner organs [17]. Finally, for frequencies above 10 Hz there is little we can do except put up with them.
Road and rail travellers experience low frequency vibrations mainly through the the suspension, which responds to bumps and hollows in the running surface, and transmits to the vehicle structure any components that it cannot filter out (see Sections G1114 and G1115). Engine vibrations occur at a much higher frequency, leaking through the engine mountings into different areas of the vehicle bodywork, which may or may not resonate in sympathy. Reciprocating engines such as the diesel engine are the worst offenders because of their rapidly oscillating pistons and connecting rods, which inject a steady beat into the lower decks of a passenger ferry. By contrast, vibrational input to the passenger compartment from the electric motors of a modern high-speed train is small.
Human body resonances
Engineers try to suppress vibrations in vehicles because they hasten mechanical wear as well as making the journey unpleasant. The human body consists of rigid struts and shells, elastic ligaments, and fluid vessels, which together behave like an intricate assembly of springs and dampers. Different parts are sensitive to vibration, and while the sensitive frequency for any particular part - say, the stomach - is really a band of frequencies spread over an appreciable range, engineers think of it as a resonant frequency like the resonant frequency of a vehicle suspension. And not without cause: extreme vibrations in a sensitive range are potentially dangerous. Think of your neck as a spring with a heavy weight – your head - attached to the end. A typical human head and neck has a resonant frequency of between 1 and 2 Hz, and will oscillate uncontrollably if shaken twice per second from side to side [15].
Car passengers don’t often experience lateral vibrations of this kind. But they do experience vertical ones when travelling on rough roads and cobbled streets. Vertical oscillations can cause the inner organs of the human body to resonate within the body cavity at a frequency between 4 and 8 Hz [9] [15], which is not only unpleasant but in extreme cases can cause injury, which is why motorcyclists who compete in off-road events wear special corsets. Vibrations at the natural frequency of the shoulder region in the upper torso can affect ‘breathing comfort’ [7]. Other critical frequencies are listed in table 2. Recommended standards for maximum exposure to vibrations of different frequencies are discussed in more detail in [12] and [26].
| Mode | Human body area | Resonant frequency | Source |
| VERTICAL | Inner organs | 4 – 8 Hz | [9] [15] |
| \(\) | Shoulders | 2 – 6 Hz | [7] |
| \(\) | Head | 5 Hz | [13] |
| \(\) | Eyes | 5 – 60 Hz | [7] [13] |
| FORE-AND-AFT | Upper torso | 1 – 3 Hz | [10] [13] |
| TRANSVERSE | Upper torso | 1 – 3 Hz | [13] |
| \(\) | Head and neck | 1 – 2 Hz | [15] |
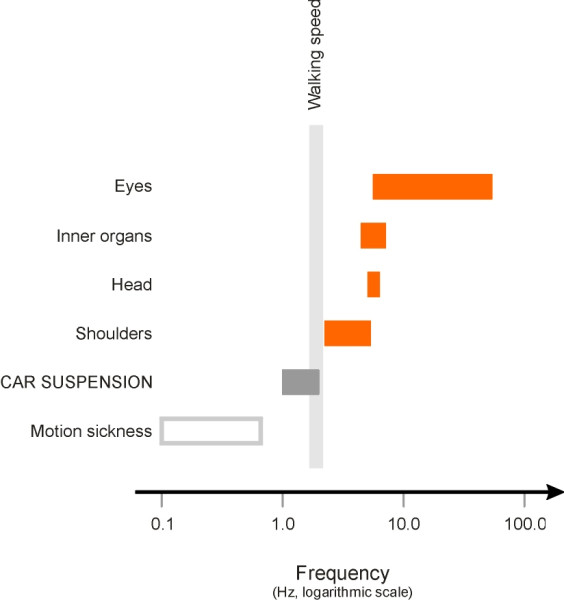
A noticeable feature of the table is that the vertical frequencies are all higher than the frequency of the human stride in everyday walking. To put it the other way around, the input frequencies from normal walking (1.5 – 2.3 Hz at 2.5 - 4 mph) are too low to excite vertical resonances [8]. The existence of such a ‘window’ is perhaps not surprising, and it is convenient for the car designer, who knows that the ride will be acceptable if the natural frequency of the suspension can be kept down to a level somewhere in this range (figure 4). And the fact that the vehicle oscillates at roughly the frequency of a walking adult could explain why a car ride will usually send a baby to sleep [2], as if being carried in its mothers arms.
Figure 4
How much vibration can we take?
It seems that human beings adjust to vibrations in different ways according to their frequency. So it’s not surprising that the levels that people can tolerate vary with frequency too. In fact, the vibrations are usually divided into three main frequency bands, and the maximum level in each band specified in terms of a different parameter, as shown in table 3 (jerk at low frequencies, acceleration in the middle range, and velocity for high frequencies; see for example [16], [27]).
table 3 derives from work carried out at the Chrysler Corporation during the late 1940s, which continues to underpin design standards throughout the car industry today. But it’s possible to approach the problem in a different way, by picturing the internal organs of the human body as a single visco-elastic mass that absorbs energy when it is forced to vibrate. Since the energy is converted into heat, a rough ride makes your insides warmer, and the rougher the ride, the warmer you get. Accordingly, NATO administrators have used the rate of heat production as a criterion for discomfort when riding in military vehicles [28]. The acceptable limit over a long journey is 6 W.
| Frequency band | Criterion | Maximum tolerable level |
| 1 – 6 Hz | Jerk | 12.6 m/s3 |
| 6 – 20 Hz | Acceleration | 0.33 m/s2 |
| 20 – 60 Hz | Velocity | 2.7 mm/s |
Motion sickness
Whether travelling by land, sea or air, many of us are affected to some degree by motion sickness. The proportion of the population so affected is roughly one in ten, and a small minority cannot travel by bus or car at all: after a few minutes they have to stop and get out. The effect occurs at frequencies below 1 Hz, and while experiments suggest there is no single cause, a common factor seems to be conflicting messages to the brain. On the one hand, there are visual messages concerning the position of the ground, the sky and the horizon, from which the passenger deduces his or her orientation. On the other hand, there are lateral, longitudinal and vertical accelerations of the vehicle. Those with frequencies below 0.5 Hz lead the balance centre in the inner ear to deduce a different orientation, and one that is swaying about wildly. The brain therefore becomes confused about which way is ‘up’, and the result is nausea [11]. Children are more vulnerable than adults.
Different kinds of vehicle trigger motion sickness in different ways. When floating freely outside the earth’s atmosphere, a space vehicle imposes no external forces on its occupants at all, yet around half of all astronauts suffer from space sickness. Most need three days to acclimatise [14]. On boats and ships, motion sickness is triggered largely by the vertical heave that is characteristic of sea-going craft, as is the case with air travel, which can pose significant problems for military air crew during combat. Car passengers, by contrast, are mainly affected by longitudinal motion of the kind that occurs during repeated braking and acceleration. The effect is less acute for passengers in vehicles with a hard suspension, perhaps because in the process of being shaken about, humans lose some of their sensitivity to disturbing forces, and the contrast between the messages from the eye and those from the inner ear becomes less noticeable.
Motion sickness affects other mammals beside humans. Apparently, it affects fish as well. But perhaps the strangest form of motion sickness occurs when there is no motion at all, in a driving simulator. The simulator is a mock-up of a car interior. It is bolted to the ground, so the driver experiences none of the acceleration forces that arise during a real car ride. Instead, the system relies on other stimuli to create the impression of movement. They include sound, vibration and computer-generated views of the road and the surrounding landscape projected onto the windows. Nevertheless, the results are sufficiently realistic to fool the brain, which expects to receive acceleration stimuli consistent with the apparent motion of the vehicle. These are of course absent, and the resulting confusion between the balance centre and other parts of the brain leads to a form of ‘motion sickness’ that many have found worse than the real thing.
Crash impact
So far we have touched on various kinds of acceleration that may be uncomfortable, but unless they are sustained over a long period, pose little risk to the occupants of a modern vehicle. Now we move on to the most dangerous ones: those that occur during a collision. We’ll focus entirely on road vehicles, and touch only on a few main points here. You’ll find a concise historical summary of the field by Mackay [19] in a volume of collected papers [1]. For a more recent review see [3], and for details of US practice see [24].
The forces that arise during impact last only for between a tenth and a fifth of a second [4] but they are many times higher than those arising from bumpy roads. For the past 50 years, engineers and physiologists have been studying crash impacts, and found that most involve two ‘collisions’ not one. First, the car collides with something, and then the occupants collide with the interior of the car. In most cases, it is the second collision that causes injury.
The impact sequence
Suppose that a car containing one occupant is moving initially at speed \(v\) when it hits a stationary object. (This is not the only possible scenario of course; the car might be hit by another vehicle from behind while it is stationary at a traffic signal for example. Or two moving cars might collide. However, the same principles apply.) Four things happen in rapid sequence:
- The front of the car begins to crumple in the area where contact first occurs, while the remainder of the car continues to move forward.
- The outer shell and then the structural members of the car deform progressively, and as they do so, they exert a braking force on the passenger compartment, which begins to slow down.
- The passenger compartment is now decelerating rapidly, and comes to a halt within a distance of less than a metre. The occupant is still moving.
- Different parts of the occupant’s torso now collide with the interior in a fairly predictable sequence. For example if there is no seat belt or airbag, the first collision occurs between the occupant’s feet and the toe board, then the knees with the instrument panel, then the chest with the steering wheel, and finally the head with the windscreen.
During stages 1 to 3, various parts of the car decelerate from initial speed \(v\) to zero. Deceleration of the occupant’s body doesn’t begin until the secondary impact in stage 4, when it hits an interior surface and is then brought to rest. So what determines how severely he or she might be injured?
Injuries, and how to prevent them
In the crash scenario we have just described, two factors stand out. The first is the time over which deceleration of the occupant’s body takes place, and the second is the area over which contact occurs. Let’s look at the ‘time’ effect first. We’ll denote the duration of the secondary impact by \(t_{occ}\) (usually measured in milliseconds). From equation 3 it is clear that the force on the occupant’s body at any instant is proportional to the acceleration. If we assume as a crude approximation that the acceleration \(a_{occ}\) (whose value is negative in this case) is constant, we can work out its value from the well-known formula:
(5)
\[\begin{equation} v_{2}\quad = \quad v_{1}\;\; + \;\;at_{occ} \end{equation}\]Putting \(v_{1} = v\), \(v_{2} = 0\), \(a = a_{occ}\) and re-arranging, we get
(6)
\[\begin{equation} a_{occ}\quad = \quad - \,\frac{v}{t_{occ}} \end{equation}\]It’s now obvious that if \(t_{occ}\) is short, the occupant will undergo high deceleration and experience correspondingly high forces. On the other hand, if \(t_{occ}\) is longer, the forces will be smaller. This is equivalent to saying the distance over which the occupant is brought to rest should be maximised: the greater the deformation of the contact surfaces, the more gradual the deceleration and the smaller the forces applied to the occupant’s body.
This is not just a question of choosing the right material, but also one of geometry. Ideally, the distance between the surface and the occupant should be as small as possible so that when the passenger compartment begins to decelerate, a braking force is transmitted to his or her body as early as possible during the impact sequence. Otherwise the occupant continues unchecked while the passenger compartment decelerates, and the period \(t_{occ}\)over which the retarding forces can do their work is reduced. The worst possible case is when the occupant is not restrained at all but hits the inside of the stationary vehicle at full speed.
The second factor has to do with the distribution of forces over the occupant’s body. As shown in table 4, these forces vary according to the nature of the material and the stiffness of the underlying structure. But humans can tolerate enormous accelerations if the forces are spread out. In an experiment carried out by the US Air Force using a rocket powered sled on a specially built track, research scientist Dr John Stapp survived a 45g stop from 1017 km/h in a forward-facing seat to which he was harnessed with a seat belt of his own design (see web site listed at the end of this section [29]). Such a harness is not suitable for mass-production cars, but a lap-and-diagonal seat belt in combination with an airbag to protect one’s face and head works pretty well.
| \(\) | Average | Peak |
| Passenger compartment as a whole | 15g | 18-28g |
| Occupant’s head against windscreen | 60g | 90g |
| Occupant’s head against roof rail | about 500g | |
Not everyone likes to wear a selt belt, but it reduces the likelihood of injury in four distinct ways. First, it stops one’s body hitting a hard and unyielding part of the car interior. Second, being in contact with your hip and chest almost from the beginning of the impact, it starts to decelerate your body at the earliest possible moment and by extending the deceleration period it lessens the peak load (the seatbelt must be tight). Thirdly it deforms, and by doing so it further extends the deceleration period (the belt must stretch). Finally, by spreading the force over an appreciable area it prevents local concentrations that might otherwise cause more damage.
Collisions with pedestrians
Design improvements have made crashes survivable and contributed towards a steady decline in road injuries over the last fifty years. But attention has only recently turned to the impact of cars on pedestrians - a curious omission given that pedestrians account for more than half of all people killed annually on the road world-wide.
Contrary to what many people believe, pedestrians are not usually ‘run over’. Instead they are run under [21]. When an adult is hit by a car, the first point of impact is around knee height, well below the pedestrian’s centre of mass. Consequently, he or she is rotated over the engine compartment and carried along momentarily, only to slide off when the car brakes to a halt. If the car is travelling faster, the pedestrian will hit the windscreen. Faster still, and the car will pass completely underneath. At first sight, it appears that there is little the engineer can do to reduce the impact, but in fact, the principles that govern occupant protection apply equally to pedestrian protection. As well as a yielding interior, the pedestrian-friendly car has a yielding exterior too. Significant gains have already been made, for example by removing protruding body trim, and raising the profile of the engine cover to create a gap into which it can deform before it makes contact with the cylinder head beneath.
Postscript
In this section we have tried to describe the forces that shake people about when they ride in vehicles. This is a particularly important issue for bus passengers. More than thirty years ago, a series of experiments was carried out on selected services in the UK [18]. High jerk levels were observed during gear changes, at stops, and during emergency braking, and there were large variations in jerk profile between different routes. Yet from the passenger’s point of view, a smooth ride with no sudden lurches is quite important - it affects the perceived quality of service [22] [25]. This is not merely a question of comfort: most of the casualties associated with bus accidents are passengers who have fallen over inside. When applied suddenly, quite low acceleration levels can cause them to stumble heavily against stanchions or miss a handhold. The bus doesn’t need to hit anything: severe braking or a sharp turn will do the trick.
While the ride quality may have improved since 1980, there is now an opportunity for more radical change. Image processing systems together with ‘intelligent’ microprocessor control can override the driver’s input and reduce the jerkiness associated with braking and acceleration. Precision-formed concrete tracks provide a smoother running surface. Several European companies now offer buses that will automatically follow magnetic markers or white lines painted on the road so the trajectory is more predictable. The vehicle follows a prescribed path as if it were on rails, just like a tram.
Acknowledgement
Illustration on opening page ’Riding in a camper van’ by Penny Wright.
Revised 12 February 2015